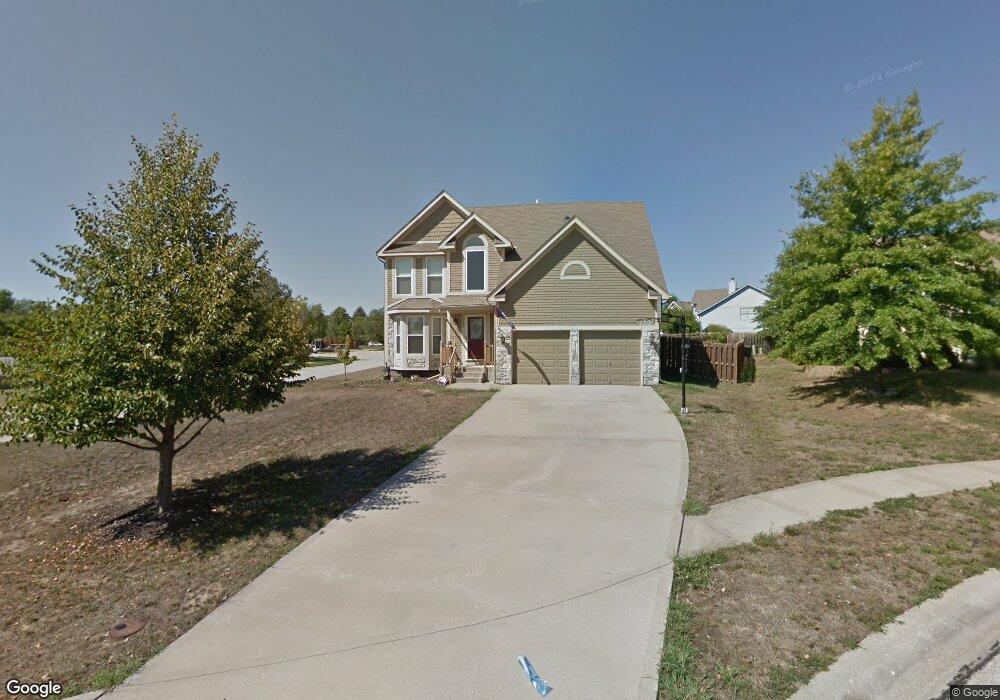
5044 Noreston St Shawnee, KS 66226
Estimated Value: $419,000 - $445,000
4
Beds
4
Baths
1,921
Sq Ft
$224/Sq Ft
Est. Value
About This Home
This home is located at 5044 Noreston St, Shawnee, KS 66226 and is currently estimated at $429,490, approximately $223 per square foot. 5044 Noreston St is a home located in Johnson County with nearby schools including Clear Creek Elementary School, Monticello Trails Middle School, and Mill Valley High School.
Ownership History
Date
Name
Owned For
Owner Type
Purchase Details
Closed on
Jun 16, 2020
Sold by
Gear Angela M and Hart Angela M
Bought by
Gear Angela M and Gear Steven
Current Estimated Value
Home Financials for this Owner
Home Financials are based on the most recent Mortgage that was taken out on this home.
Original Mortgage
$211,000
Outstanding Balance
$186,622
Interest Rate
3.2%
Mortgage Type
New Conventional
Estimated Equity
$242,868
Purchase Details
Closed on
Oct 14, 2016
Sold by
Wright Mary Ellen and Wright Danny L
Bought by
Hart Angela M
Home Financials for this Owner
Home Financials are based on the most recent Mortgage that was taken out on this home.
Original Mortgage
$183,612
Interest Rate
3.37%
Mortgage Type
FHA
Purchase Details
Closed on
Jun 24, 2011
Sold by
Ogrady Sean G and Ogrady Candice
Bought by
Wright Danny L and Wright Mary Ellen
Create a Home Valuation Report for This Property
The Home Valuation Report is an in-depth analysis detailing your home's value as well as a comparison with similar homes in the area
Home Values in the Area
Average Home Value in this Area
Purchase History
| Date | Buyer | Sale Price | Title Company |
|---|---|---|---|
| Gear Angela M | -- | Solidifi | |
| Hart Angela M | -- | Continental Title | |
| Wright Danny L | -- | Chicago Title Ins Co |
Source: Public Records
Mortgage History
| Date | Status | Borrower | Loan Amount |
|---|---|---|---|
| Open | Gear Angela M | $211,000 | |
| Closed | Hart Angela M | $183,612 |
Source: Public Records
Tax History Compared to Growth
Tax History
| Year | Tax Paid | Tax Assessment Tax Assessment Total Assessment is a certain percentage of the fair market value that is determined by local assessors to be the total taxable value of land and additions on the property. | Land | Improvement |
|---|---|---|---|---|
| 2024 | $5,073 | $43,712 | $7,649 | $36,063 |
| 2023 | $4,989 | $42,447 | $7,649 | $34,798 |
| 2022 | $4,687 | $39,065 | $7,276 | $31,789 |
| 2021 | $4,227 | $33,833 | $6,618 | $27,215 |
| 2020 | $3,876 | $30,728 | $5,760 | $24,968 |
| 2019 | $3,733 | $29,152 | $5,231 | $23,921 |
| 2018 | $3,460 | $26,772 | $5,231 | $21,541 |
| 2017 | $3,295 | $24,863 | $4,376 | $20,487 |
| 2016 | $3,364 | $25,082 | $4,376 | $20,706 |
| 2015 | $3,042 | $22,345 | $4,376 | $17,969 |
| 2013 | -- | $20,275 | $4,376 | $15,899 |
Source: Public Records
Map
Nearby Homes
- 22014 W 51st St
- 5116 Payne St
- 21525 W 51st St
- 5005 Hilltop Dr
- 22115 W 51st Terrace
- 21408 W 50th St
- 22014 W 47th Terrace
- 5206 Round Prairie St
- 21804 W 52nd Terrace
- 4713 Lone Elm
- 21222 W 48th St
- 4754 Lakecrest Dr
- 5307 Noble St
- 22625 W 49th St
- 21624 W 53rd Terrace
- 4638 Aminda St
- 22714 W 49th St
- 5402 Roundtree St
- 5311 Brownridge Dr
- 22611 W 46th Terrace
- 21806 W 51st St
- 5040 Noreston St
- 5104 Noreston St
- 5036 Noreston St
- 21807 W 51st St
- 5045 Noreston St
- 21810 W 51st St
- 5041 Noreston St
- 21725 W 50th St
- 5101 Noreston St
- 21721 W 50th St
- 5110 Noreston St
- 21729 W 50th St
- 21714 W 51st St
- 21717 W 50th St
- 21811 W 51st St
- 21814 W 51st St
- 21715 W 50th Terrace
- 5105 Noreston St
- 21803 W 50th St