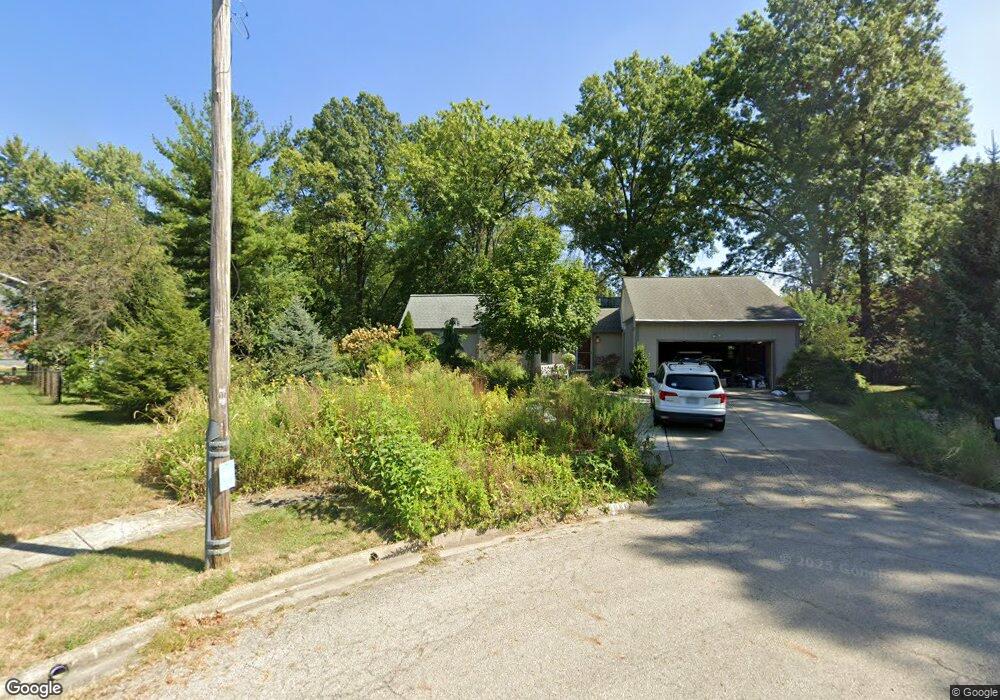
5048 Link Ct Columbus, OH 43213
The Fairway NeighborhoodEstimated Value: $316,363 - $371,000
3
Beds
2
Baths
1,993
Sq Ft
$169/Sq Ft
Est. Value
About This Home
This home is located at 5048 Link Ct, Columbus, OH 43213 and is currently estimated at $336,841, approximately $169 per square foot. 5048 Link Ct is a home located in Franklin County with nearby schools including Etna Road Elementary School, Beechwood Elementary School, and Rosemore Middle School.
Ownership History
Date
Name
Owned For
Owner Type
Purchase Details
Closed on
Mar 30, 2015
Sold by
Canneto Luisa Max
Bought by
Canneto Stephen F
Current Estimated Value
Purchase Details
Closed on
Nov 15, 2013
Sold by
Canneto Stephen F
Bought by
Canneto Luisa Max
Purchase Details
Closed on
Dec 8, 2009
Sold by
Morrison Catherine E
Bought by
Canneto Stephen F
Home Financials for this Owner
Home Financials are based on the most recent Mortgage that was taken out on this home.
Original Mortgage
$190,221
Outstanding Balance
$124,835
Interest Rate
5.02%
Mortgage Type
FHA
Estimated Equity
$212,006
Purchase Details
Closed on
Jul 26, 2000
Sold by
Morrison George E
Bought by
Morrison Catherine E
Purchase Details
Closed on
Nov 24, 1997
Sold by
Leighton C Thomas
Bought by
Morrison George E and Morrison Catherine E
Purchase Details
Closed on
Sep 15, 1975
Bought by
Morrison George E
Create a Home Valuation Report for This Property
The Home Valuation Report is an in-depth analysis detailing your home's value as well as a comparison with similar homes in the area
Home Values in the Area
Average Home Value in this Area
Purchase History
| Date | Buyer | Sale Price | Title Company |
|---|---|---|---|
| Canneto Stephen F | -- | None Available | |
| Canneto Luisa Max | -- | None Available | |
| Canneto Stephen F | $139,000 | Chicago Tit | |
| Morrison Catherine E | -- | -- | |
| Morrison George E | -- | -- | |
| Morrison George E | -- | -- |
Source: Public Records
Mortgage History
| Date | Status | Borrower | Loan Amount |
|---|---|---|---|
| Open | Canneto Stephen F | $190,221 |
Source: Public Records
Tax History Compared to Growth
Tax History
| Year | Tax Paid | Tax Assessment Tax Assessment Total Assessment is a certain percentage of the fair market value that is determined by local assessors to be the total taxable value of land and additions on the property. | Land | Improvement |
|---|---|---|---|---|
| 2024 | $3,995 | $91,390 | $22,750 | $68,640 |
| 2023 | $3,967 | $91,385 | $22,750 | $68,635 |
| 2022 | $3,572 | $62,550 | $17,500 | $45,050 |
| 2021 | $3,355 | $62,550 | $17,500 | $45,050 |
| 2020 | $3,321 | $62,550 | $17,500 | $45,050 |
| 2019 | $3,074 | $50,330 | $14,000 | $36,330 |
| 2018 | $3,303 | $50,330 | $14,000 | $36,330 |
| 2017 | $3,207 | $50,330 | $14,000 | $36,330 |
| 2016 | $3,445 | $52,750 | $13,860 | $38,890 |
| 2015 | $3,475 | $52,750 | $13,860 | $38,890 |
| 2014 | $3,475 | $52,750 | $13,860 | $38,890 |
| 2013 | $1,466 | $55,510 | $14,595 | $40,915 |
Source: Public Records
Map
Nearby Homes
- 547 Country Club Rd
- 686 Fairway Blvd
- 855 Dimson Dr E
- 4780 Etna Rd Unit 782
- 424 Cumberland Dr
- 469 Cumberland Dr
- 322 Fairway Cir
- 931 Antwerp Rd
- 353 Shell Ct E
- 4653 Kae Ave
- 4662 Jae Ave
- 571 S Hamilton Rd
- 1120 Fairway Blvd
- 4991 Justin Rd
- 451 Beaver Ave
- 1130 Little Plum Ln
- 4489 Saint Margaret Ln
- 5671 Bastille Place
- 5613 Chowning Way Unit 6B
- 579 Westphal Ave