Estimated Value: $462,000 - $534,000
4
Beds
3
Baths
2,284
Sq Ft
$220/Sq Ft
Est. Value
About This Home
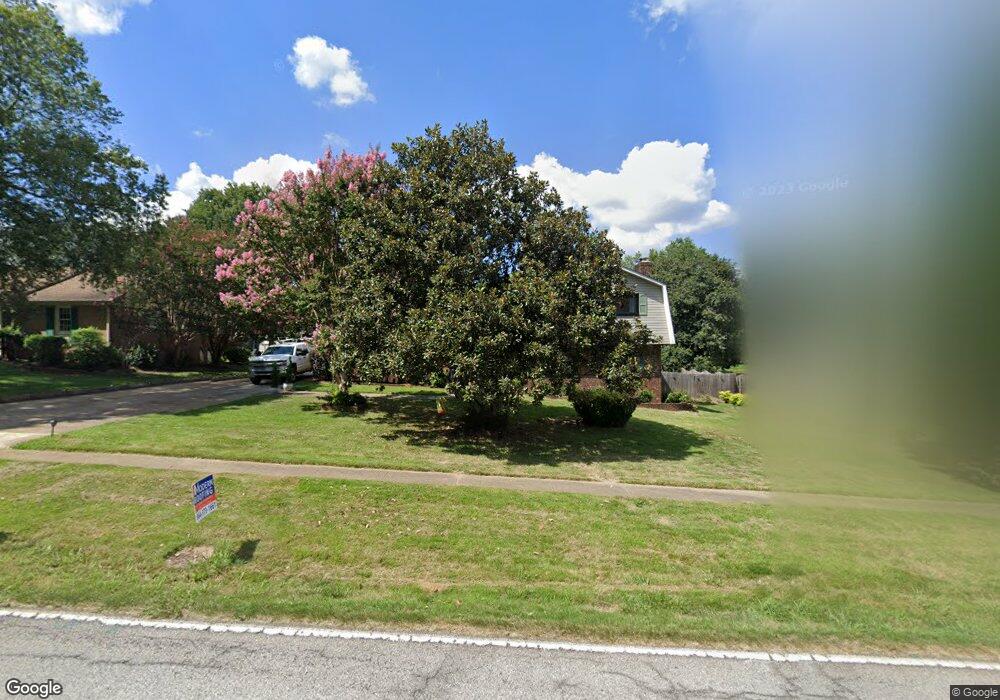
This home is located at 505 Devenger Rd, Greer, SC 29650 and is currently estimated at $502,229, approximately $219 per square foot. 505 Devenger Rd is a home located in Greenville County with nearby schools including Pelham Road Elementary School, Greenville Middle Academy, and Eastside High School.
Ownership History
Date
Name
Owned For
Owner Type
Purchase Details
Closed on
Jun 15, 2022
Sold by
Cynthia Rush Revocable Living Trust
Bought by
Hogancamp Orville Keith
Current Estimated Value
Home Financials for this Owner
Home Financials are based on the most recent Mortgage that was taken out on this home.
Original Mortgage
$360,000
Outstanding Balance
$340,674
Interest Rate
5.3%
Mortgage Type
New Conventional
Estimated Equity
$161,555
Purchase Details
Closed on
Feb 1, 2022
Sold by
Cynthia M Rush Revocable Living Trust
Bought by
Deborah Rush Cathcart Trust
Purchase Details
Closed on
Nov 21, 2014
Sold by
Rush William C
Bought by
Rush Cynthia M
Purchase Details
Closed on
Jun 25, 2010
Sold by
Rush Cynthia M
Bought by
Rush William C
Purchase Details
Closed on
Jun 19, 2006
Sold by
Rush Cynthia M
Bought by
Rush Cynthia M
Create a Home Valuation Report for This Property
The Home Valuation Report is an in-depth analysis detailing your home's value as well as a comparison with similar homes in the area
Home Values in the Area
Average Home Value in this Area
Purchase History
| Date | Buyer | Sale Price | Title Company |
|---|---|---|---|
| Hogancamp Orville Keith | $450,000 | None Listed On Document | |
| Deborah Rush Cathcart Trust | -- | None Listed On Document | |
| Rush Cynthia M | -- | -- | |
| Rush William C | $150,000 | -- | |
| Rush Cynthia M | -- | None Available |
Source: Public Records
Mortgage History
| Date | Status | Borrower | Loan Amount |
|---|---|---|---|
| Open | Hogancamp Orville Keith | $360,000 |
Source: Public Records
Tax History
| Year | Tax Paid | Tax Assessment Tax Assessment Total Assessment is a certain percentage of the fair market value that is determined by local assessors to be the total taxable value of land and additions on the property. | Land | Improvement |
|---|---|---|---|---|
| 2025 | $3,117 | $18,800 | $3,020 | $15,780 |
| 2024 | $3,244 | $17,700 | $1,790 | $15,910 |
| 2023 | $3,244 | $17,700 | $1,790 | $15,910 |
| 2022 | $1,270 | $6,850 | $1,240 | $5,610 |
| 2021 | $1,250 | $6,850 | $1,240 | $5,610 |
| 2020 | $1,166 | $5,960 | $1,080 | $4,880 |
| 2019 | $1,156 | $5,960 | $1,080 | $4,880 |
| 2018 | $1,222 | $5,960 | $1,080 | $4,880 |
| 2017 | $1,211 | $5,960 | $1,080 | $4,880 |
| 2016 | $1,160 | $148,940 | $27,000 | $121,940 |
| 2015 | $1,155 | $148,940 | $27,000 | $121,940 |
| 2014 | $1,146 | $150,573 | $29,858 | $120,715 |
Source: Public Records
Map
Nearby Homes
- 703 Hedgewood Terrace
- 704 Hedgewood Terrace
- 100 Bridle Way
- 516 Foxcroft Rd
- 217 Parliament Rd
- 301 Rosebud Ln
- 107 Longstreet Dr
- 209 Governors Square
- 128 Paddock Dr
- 205 Longstreet Dr
- 11 Caliston Ct
- 105 Birnam Ct
- 207 Sun Garden Ct
- 100 Terrence Ct
- 17 Seabury Dr
- 323 Majesty Ct
- 322 Majesty Ct
- 206 Carolena Rose Way
- 17 Thurlow Ct
- 3 Hibourne Ct
- 503 Devenger Rd
- 507 Devenger Rd
- 111 Richfield Terrace
- 109 Richfield Terrace
- 501 Devenger Rd
- 113 Richfield Terrace
- 107 Richfield Terrace
- 508 Devenger Rd
- 500 Devenger Rd
- 115 Richfield Terrace
- 105 Richfield Terrace
- 510 Devenger Rd
- 511 Devenger Rd
- 407 Devenger Rd
- 3 Foxcroft Rd
- 103 Richfield Terrace
- 112 Richfield Terrace
- 110 Richfield Terrace
- 117 Richfield Terrace
- 512 Devenger Rd
Your Personal Tour Guide
Ask me questions while you tour the home.