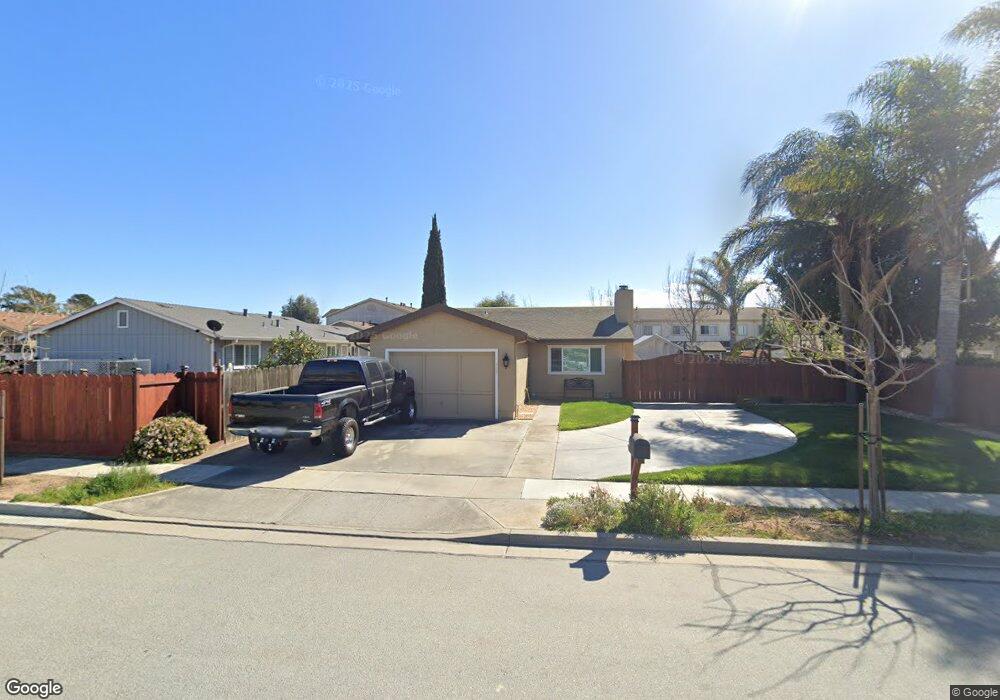
505 Granada Ct Soledad, CA 93960
Estimated Value: $549,000 - $753,921
3
Beds
2
Baths
1,208
Sq Ft
$505/Sq Ft
Est. Value
About This Home
This home is located at 505 Granada Ct, Soledad, CA 93960 and is currently estimated at $610,480, approximately $505 per square foot. 505 Granada Ct is a home located in Monterey County with nearby schools including Gabilan Elementary School, Main Street Middle School, and Soledad High School.
Ownership History
Date
Name
Owned For
Owner Type
Purchase Details
Closed on
Sep 27, 2011
Sold by
Pantoja Monica A and Aguilar Monica
Bought by
Pantoja Jaime and Pantoja Monica A
Current Estimated Value
Home Financials for this Owner
Home Financials are based on the most recent Mortgage that was taken out on this home.
Original Mortgage
$117,911
Outstanding Balance
$11,188
Interest Rate
4.16%
Mortgage Type
New Conventional
Estimated Equity
$599,292
Purchase Details
Closed on
Feb 15, 2002
Sold by
Zavala Maria Luz O
Bought by
Aguilar Monica
Home Financials for this Owner
Home Financials are based on the most recent Mortgage that was taken out on this home.
Original Mortgage
$145,300
Interest Rate
6.85%
Purchase Details
Closed on
Jan 11, 1994
Sold by
Serrato Roberto and Hernandez Oneida
Bought by
Ortega Maria Luz and Hernandez Ricardo
Home Financials for this Owner
Home Financials are based on the most recent Mortgage that was taken out on this home.
Original Mortgage
$107,000
Interest Rate
4.5%
Create a Home Valuation Report for This Property
The Home Valuation Report is an in-depth analysis detailing your home's value as well as a comparison with similar homes in the area
Home Values in the Area
Average Home Value in this Area
Purchase History
| Date | Buyer | Sale Price | Title Company |
|---|---|---|---|
| Pantoja Jaime | -- | First American Title Company | |
| Aguilar Monica | -- | Old Republic Title | |
| Ortega Maria Luz | -- | Old Republic Title Company |
Source: Public Records
Mortgage History
| Date | Status | Borrower | Loan Amount |
|---|---|---|---|
| Open | Pantoja Jaime | $117,911 | |
| Closed | Aguilar Monica | $145,300 | |
| Previous Owner | Ortega Maria Luz | $107,000 |
Source: Public Records
Tax History
| Year | Tax Paid | Tax Assessment Tax Assessment Total Assessment is a certain percentage of the fair market value that is determined by local assessors to be the total taxable value of land and additions on the property. | Land | Improvement |
|---|---|---|---|---|
| 2025 | $3,019 | $238,369 | $78,006 | $160,363 |
| 2024 | $3,019 | $233,696 | $76,477 | $157,219 |
| 2023 | $2,738 | $229,115 | $74,978 | $154,137 |
| 2022 | $2,776 | $224,623 | $73,508 | $151,115 |
| 2021 | $2,684 | $220,219 | $72,067 | $148,152 |
| 2020 | $2,642 | $217,962 | $71,329 | $146,633 |
| 2019 | $2,584 | $213,689 | $69,931 | $143,758 |
| 2018 | $2,621 | $209,500 | $68,560 | $140,940 |
| 2017 | $2,530 | $205,393 | $67,216 | $138,177 |
| 2016 | $2,418 | $201,367 | $65,899 | $135,468 |
| 2015 | $2,384 | $198,344 | $64,910 | $133,434 |
| 2014 | $2,374 | $194,460 | $63,639 | $130,821 |
Source: Public Records
Map
Nearby Homes
- 35095 Metz Rd
- 641 Main St
- 615 Monterey St
- 570 Tankersley St
- 1117 Palm Ave
- 509 Davalos St
- 638 Robledo Dr
- 665 Molera Ave
- 704 Gabilan Dr
- 1061 Vista Ave
- 836 Vasquez Dr
- 1311 San Antonio
- 1249 La Colina St
- 1390 Appalachian St
- 715 Skinner St
- 31102 Camphora Gloria Rd
- 33900 Fabry Rd
- 35700 Eagle Ridge
- 30625 Stonewall Canyon Rd
- 36527 Metz Rd
- 591 Andalucia Dr
- 509 Granada Ct
- 515 Granada Ct
- 522 Granada Ct
- 601 Andalucia Dr
- 400 Granada St
- 526 Granada Ct
- 519 Granada Ct
- 607 Andalucia Dr
- 523 Granada Ct
- 602 Andalucia Dr
- 404 Granada St
- 530 Granada Ct
- 527 Granada Ct
- 611 Andalucia Dr
- 606 Andalucia Dr
- 595 Walker Dr
- 522 Soledad St
- 531 Granada Ct
- 534 Granada Ct
Your Personal Tour Guide
Ask me questions while you tour the home.