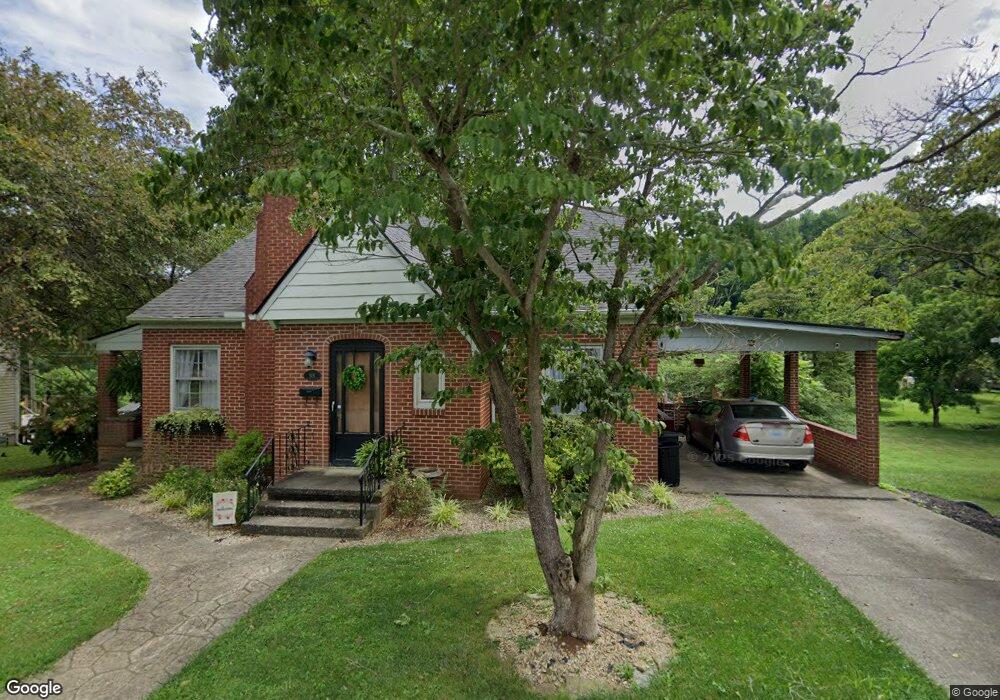
505 Holcomb St Grayson, KY 41143
Estimated Value: $134,000 - $193,000
2
Beds
1
Bath
680
Sq Ft
$228/Sq Ft
Est. Value
About This Home
This home is located at 505 Holcomb St, Grayson, KY 41143 and is currently estimated at $154,973, approximately $227 per square foot. 505 Holcomb St is a home located in Carter County with nearby schools including Prichard Elementary School, East Carter Middle School, and East Carter County High School.
Ownership History
Date
Name
Owned For
Owner Type
Purchase Details
Closed on
Dec 19, 2020
Sold by
Harper Grant Michael and Harper Rachel Lynn
Bought by
Adams Caden Scott and Damron Adriannah Nicole
Current Estimated Value
Home Financials for this Owner
Home Financials are based on the most recent Mortgage that was taken out on this home.
Original Mortgage
$102,000
Outstanding Balance
$82,666
Interest Rate
2.8%
Mortgage Type
Future Advance Clause Open End Mortgage
Estimated Equity
$72,307
Purchase Details
Closed on
Mar 26, 2007
Sold by
Satterly Beryl and Satterly Barbara
Bought by
Harper Grant M and Harper Carol
Home Financials for this Owner
Home Financials are based on the most recent Mortgage that was taken out on this home.
Original Mortgage
$85,000
Interest Rate
6.25%
Mortgage Type
Assumption
Create a Home Valuation Report for This Property
The Home Valuation Report is an in-depth analysis detailing your home's value as well as a comparison with similar homes in the area
Home Values in the Area
Average Home Value in this Area
Purchase History
| Date | Buyer | Sale Price | Title Company |
|---|---|---|---|
| Adams Caden Scott | $115,000 | None Available | |
| Harper Grant M | $85,000 | None Available |
Source: Public Records
Mortgage History
| Date | Status | Borrower | Loan Amount |
|---|---|---|---|
| Open | Adams Caden Scott | $102,000 | |
| Previous Owner | Harper Grant M | $85,000 |
Source: Public Records
Tax History Compared to Growth
Tax History
| Year | Tax Paid | Tax Assessment Tax Assessment Total Assessment is a certain percentage of the fair market value that is determined by local assessors to be the total taxable value of land and additions on the property. | Land | Improvement |
|---|---|---|---|---|
| 2024 | $1,008 | $117,500 | $0 | $0 |
| 2023 | $1,013 | $117,500 | $0 | $0 |
| 2022 | $1,016 | $117,500 | $0 | $0 |
| 2021 | $1,014 | $115,000 | $0 | $0 |
| 2020 | $752 | $85,000 | $5,000 | $80,000 |
| 2019 | $750 | $85,000 | $5,000 | $80,000 |
| 2018 | $750 | $85,000 | $5,000 | $80,000 |
| 2017 | $715 | $85,000 | $5,000 | $80,000 |
| 2016 | $714 | $85,000 | $5,000 | $80,000 |
| 2015 | $697 | $85,000 | $5,000 | $80,000 |
| 2014 | $697 | $85,000 | $5,000 | $80,000 |
| 2011 | $685 | $85,000 | $0 | $0 |
Source: Public Records
Map
Nearby Homes