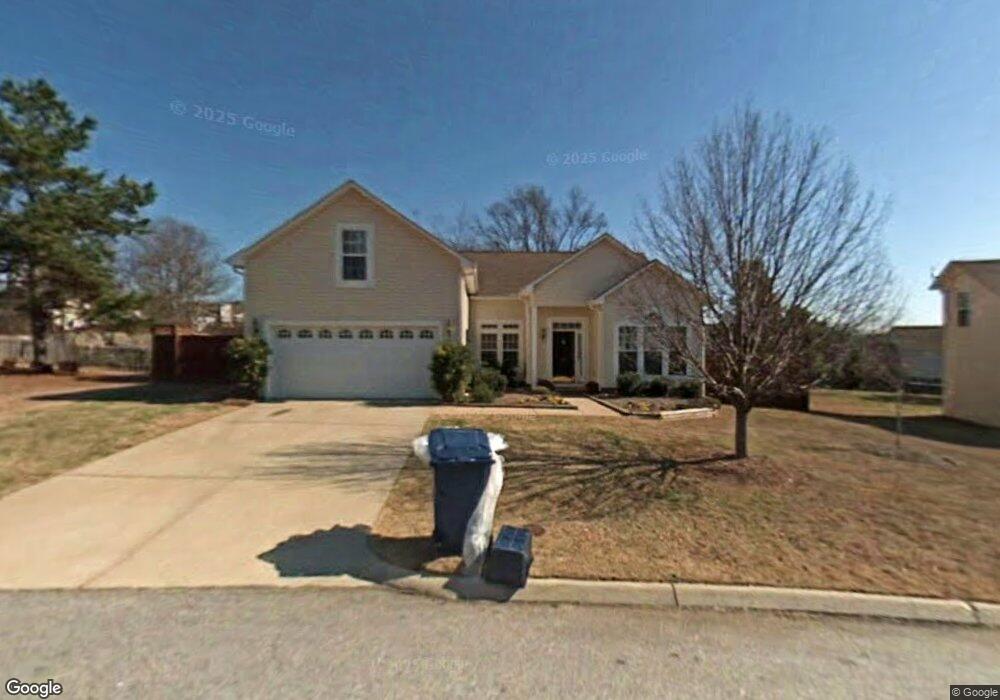
505 Hyde Park Ln Mauldin, SC 29662
Estimated Value: $299,215 - $346,000
4
Beds
2
Baths
1,969
Sq Ft
$166/Sq Ft
Est. Value
About This Home
This home is located at 505 Hyde Park Ln, Mauldin, SC 29662 and is currently estimated at $327,304, approximately $166 per square foot. 505 Hyde Park Ln is a home located in Greenville County with nearby schools including Greenbrier Elementary School, Hillcrest Middle School, and Mauldin High School.
Ownership History
Date
Name
Owned For
Owner Type
Purchase Details
Closed on
Oct 27, 2010
Sold by
Clark Thomas Scott and Clark Sarah C
Bought by
Oquinn David E and Oquinn Debra J
Current Estimated Value
Home Financials for this Owner
Home Financials are based on the most recent Mortgage that was taken out on this home.
Original Mortgage
$150,495
Interest Rate
4.76%
Mortgage Type
FHA
Purchase Details
Closed on
Aug 11, 2005
Sold by
Federal Home Loan Mortgage Corporation
Bought by
Clark Sarah C
Home Financials for this Owner
Home Financials are based on the most recent Mortgage that was taken out on this home.
Original Mortgage
$115,600
Interest Rate
5.57%
Mortgage Type
New Conventional
Purchase Details
Closed on
Jan 13, 2005
Sold by
Taylor John M
Bought by
Federal Home Loan Mortgage Corporation
Create a Home Valuation Report for This Property
The Home Valuation Report is an in-depth analysis detailing your home's value as well as a comparison with similar homes in the area
Home Values in the Area
Average Home Value in this Area
Purchase History
We collect this data history from publicly available records. To have your information removed, we recommend requesting removal directly through your county’s website.
| Date | Buyer | Sale Price | Title Company |
|---|---|---|---|
| Oquinn David E | $152,523 | -- | |
| Clark Sarah C | $144,500 | -- | |
| Federal Home Loan Mortgage Corporation | $124,500 | -- |
Source: Public Records
Mortgage History
We collect this data history from publicly available records. To have your information removed, we recommend requesting removal directly through your county’s website.
| Date | Status | Borrower | Loan Amount |
|---|---|---|---|
| Previous Owner | Oquinn David E | $150,495 | |
| Previous Owner | Federal Home Loan Mortgage Corporation | $115,600 | |
| Previous Owner | Federal Home Loan Mortgage Corporation | $21,675 |
Source: Public Records
Tax History
| Year | Tax Paid | Tax Assessment Tax Assessment Total Assessment is a certain percentage of the fair market value that is determined by local assessors to be the total taxable value of land and additions on the property. | Land | Improvement |
|---|---|---|---|---|
| 2025 | $1,068 | $8,570 | $2,120 | $6,450 |
| 2024 | $1,068 | $7,450 | $1,170 | $6,280 |
| 2023 | $976 | $7,450 | $1,170 | $6,280 |
| 2022 | $918 | $7,450 | $1,170 | $6,280 |
| 2021 | $919 | $7,450 | $1,170 | $6,280 |
| 2020 | $804 | $6,480 | $880 | $5,600 |
| 2019 | $804 | $6,480 | $880 | $5,600 |
| 2018 | $848 | $6,480 | $880 | $5,600 |
| 2017 | $848 | $6,480 | $880 | $5,600 |
| 2016 | $813 | $162,030 | $22,000 | $140,030 |
| 2015 | $813 | $162,030 | $22,000 | $140,030 |
| 2014 | $763 | $155,390 | $24,500 | $130,890 |
Source: Public Records
Map
Nearby Homes
- 101 Laport Dr
- 3 Old Hastings Ct
- 105 Poplar Springs Dr
- 15 Sea Oats Inlet
- 106 Lindseybrook Trail
- 3 Tripbrook Ct
- 10 Croftstone Ct
- 2 Trailstream Dr
- 508 Fieldgate Ct
- 103 Ridan Rd
- 9 Colombard Ct
- 400 Marsh Creek Dr
- 306 Nantallah Trail
- 464 Bishop Dr
- 456 Bishop Dr
- 122 Whitestone Ave
- 150 Pruitt Dr
- 216 Montauk Dr
- 323 Pinehurst Dr
- 31 Granite Ln
- 503 Hyde Park Ln
- 507 Hyde Park Ln
- 104 Shearbrook Dr
- 106 Shearbrook Dr
- 102 Shearbrook Dr
- 108 Shearbrook Dr
- 105 Laport Dr
- 103 Laport Dr
- 506 Hyde Park Ln
- 509 Hyde Park Ln
- 504 Hyde Park Ln
- 7 Laport Dr
- 110 Shearbrook Dr
- 502 Hyde Park Ln
- 508 Hyde Park Ln
- 5 Laport Dr
- 100 Shearbrook Dr
- 500 Hyde Park Ln
- 105 Shearbrook Dr
- 107 Shearbrook Dr
Your Personal Tour Guide
Ask me questions while you tour the home.