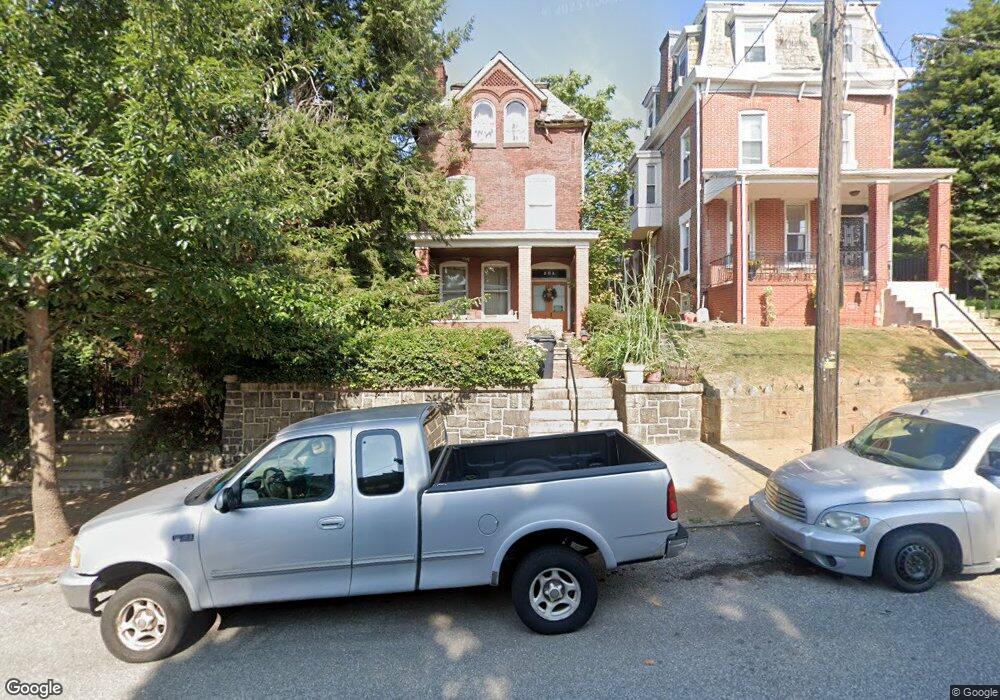
505 N Broom St Wilmington, DE 19805
Estimated Value: $164,000 - $437,000
6
Beds
3
Baths
2,700
Sq Ft
$111/Sq Ft
Est. Value
About This Home
This home is located at 505 N Broom St, Wilmington, DE 19805 and is currently estimated at $300,500, approximately $111 per square foot. 505 N Broom St is a home located in New Castle County with nearby schools including Warner Elementary School, Dupont (H.B.) Middle School, and Alexis I. du Pont High School.
Ownership History
Date
Name
Owned For
Owner Type
Purchase Details
Closed on
Jul 31, 2024
Sold by
Rhr Holdings Llc
Bought by
Rowhome Rentals Llc and Rhr Holdings Llc
Current Estimated Value
Home Financials for this Owner
Home Financials are based on the most recent Mortgage that was taken out on this home.
Original Mortgage
$375,000
Outstanding Balance
$370,821
Interest Rate
6.95%
Mortgage Type
New Conventional
Estimated Equity
-$70,321
Purchase Details
Closed on
Jul 17, 2023
Sold by
Damarose Property Development Group Llc
Bought by
Rhr Holdings Llc
Home Financials for this Owner
Home Financials are based on the most recent Mortgage that was taken out on this home.
Original Mortgage
$218,700
Interest Rate
6.69%
Mortgage Type
New Conventional
Purchase Details
Closed on
Jun 3, 2022
Sold by
Phillips Scott T
Bought by
Damarose Property Development Group Llc
Create a Home Valuation Report for This Property
The Home Valuation Report is an in-depth analysis detailing your home's value as well as a comparison with similar homes in the area
Home Values in the Area
Average Home Value in this Area
Purchase History
| Date | Buyer | Sale Price | Title Company |
|---|---|---|---|
| Rowhome Rentals Llc | -- | None Listed On Document | |
| Rhr Holdings Llc | $80,000 | Kirsh Title Services | |
| Damarose Property Development Group Llc | $69,000 | Rhodunda Williams & Kondrascho |
Source: Public Records
Mortgage History
| Date | Status | Borrower | Loan Amount |
|---|---|---|---|
| Open | Rowhome Rentals Llc | $375,000 | |
| Previous Owner | Rhr Holdings Llc | $218,700 |
Source: Public Records
Tax History Compared to Growth
Tax History
| Year | Tax Paid | Tax Assessment Tax Assessment Total Assessment is a certain percentage of the fair market value that is determined by local assessors to be the total taxable value of land and additions on the property. | Land | Improvement |
|---|---|---|---|---|
| 2024 | $28 | $22,700 | $3,900 | $18,800 |
| 2023 | $616 | $22,700 | $3,900 | $18,800 |
| 2022 | $618 | $22,700 | $3,900 | $18,800 |
| 2021 | $11,874 | $22,700 | $3,900 | $18,800 |
| 2020 | $10,529 | $22,700 | $3,900 | $18,800 |
| 2019 | $1,077 | $22,700 | $3,900 | $18,800 |
| 2018 | $146 | $22,700 | $3,900 | $18,800 |
| 2017 | $1,006 | $22,700 | $3,900 | $18,800 |
| 2016 | $1,006 | $22,700 | $3,900 | $18,800 |
| 2015 | $962 | $22,700 | $3,900 | $18,800 |
| 2014 | $913 | $22,700 | $3,900 | $18,800 |
Source: Public Records
Map
Nearby Homes
- 1308 W 5th St
- 1409 W 4th St
- 1318 W 6th St
- 1327 W 6th St
- 407 N Rodney St
- 614 N Broom St
- 1407 W 6th St
- 1222 Mccoy Way
- 305 N Franklin St
- 1322 W 3rd St
- 506 Delamore Place
- 1312 W 3rd St
- 307 N Rodney St
- 227 N Broom St
- 517 Delamore Place
- 1212 W 3rd St
- 615 N Harrison St
- 200 N Rodney St
- 415 N Clayton St
- 602 N Harrison St
- 507 N Broom St
- 503 N Broom St
- 509 N Broom St
- 511 N Broom St
- 1400 W 6th St
- 1402 W 6th St
- 427 N Broom St
- 1406 W 6th St
- 500 N Rodney St Unit 2
- 500 N Rodney St Unit 4
- 500 N Rodney St Unit 3
- 500 N Rodney St Unit 1
- 500 N Rodney St
- 500 N Rodney St Unit 8
- 500 N Rodney St Unit 6
- 500 N Rodney St Unit 7
- 1404 W 6th St
- 515 N Broom St
- 506 N Broom St
- 504 N Broom St