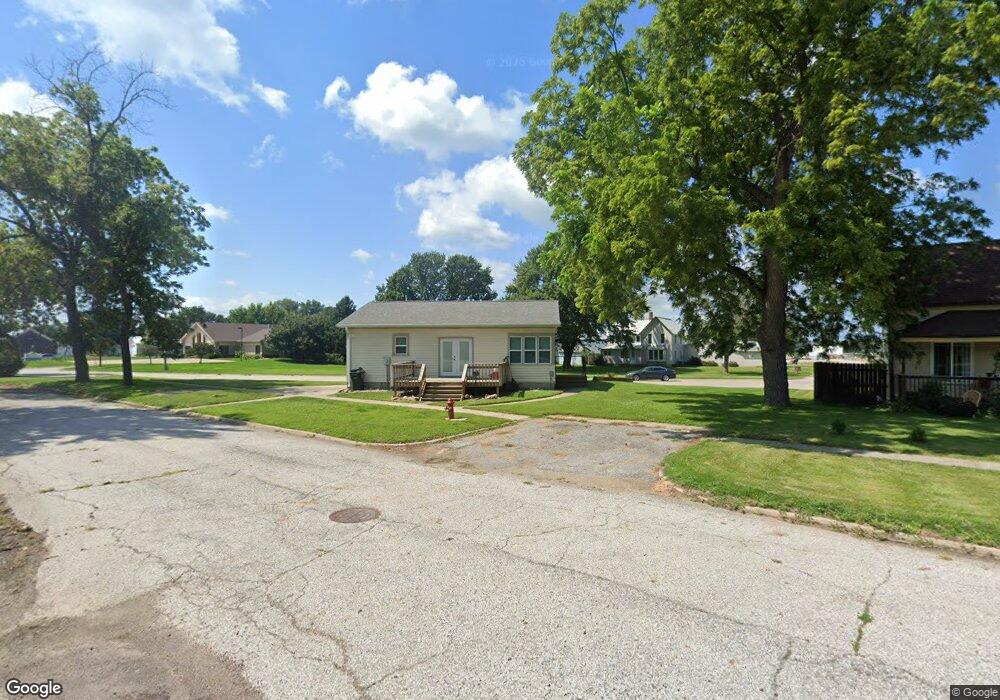
505 S Muckey St Mapleton, IA 51034
Estimated Value: $116,000 - $130,702
2
Beds
1
Bath
784
Sq Ft
$160/Sq Ft
Est. Value
About This Home
This home is located at 505 S Muckey St, Mapleton, IA 51034 and is currently estimated at $125,426, approximately $159 per square foot. 505 S Muckey St is a home with nearby schools including Mapleton Elementary School, Mvao Middle School, and Maple Valley-Anthon Oto High School.
Ownership History
Date
Name
Owned For
Owner Type
Purchase Details
Closed on
Mar 1, 2012
Sold by
Co Tk1 Inc
Bought by
Bettin Austin J
Current Estimated Value
Home Financials for this Owner
Home Financials are based on the most recent Mortgage that was taken out on this home.
Original Mortgage
$75,000
Outstanding Balance
$51,495
Interest Rate
3.86%
Mortgage Type
Credit Line Revolving
Estimated Equity
$73,931
Purchase Details
Closed on
Jun 9, 2006
Sold by
Kraft John Franklin and Kraft Norma Arlene
Bought by
Henrichs Patricia J and Simpson Donna Mae
Create a Home Valuation Report for This Property
The Home Valuation Report is an in-depth analysis detailing your home's value as well as a comparison with similar homes in the area
Purchase History
| Date | Buyer | Sale Price | Title Company |
|---|---|---|---|
| Bettin Austin J | $16,000 | None Available | |
| Henrichs Patricia J | -- | None Available |
Source: Public Records
Mortgage History
| Date | Status | Borrower | Loan Amount |
|---|---|---|---|
| Open | Bettin Austin J | $75,000 |
Source: Public Records
Tax History
| Year | Tax Paid | Tax Assessment Tax Assessment Total Assessment is a certain percentage of the fair market value that is determined by local assessors to be the total taxable value of land and additions on the property. | Land | Improvement |
|---|---|---|---|---|
| 2024 | $804 | $49,876 | $7,137 | $42,739 |
| 2023 | $752 | $49,876 | $7,137 | $42,739 |
| 2022 | $528 | $31,699 | $6,300 | $25,399 |
| 2021 | $552 | $31,699 | $6,300 | $25,399 |
| 2020 | $594 | $31,699 | $6,300 | $25,399 |
| 2019 | $594 | $32,332 | $0 | $0 |
| 2018 | $580 | $32,332 | $0 | $0 |
| 2017 | $568 | $30,792 | $0 | $0 |
| 2016 | $568 | $30,792 | $0 | $0 |
| 2015 | $536 | $27,250 | $0 | $0 |
| 2014 | $492 | $27,250 | $0 | $0 |
Source: Public Records
Map
Nearby Homes
Your Personal Tour Guide
Ask me questions while you tour the home.