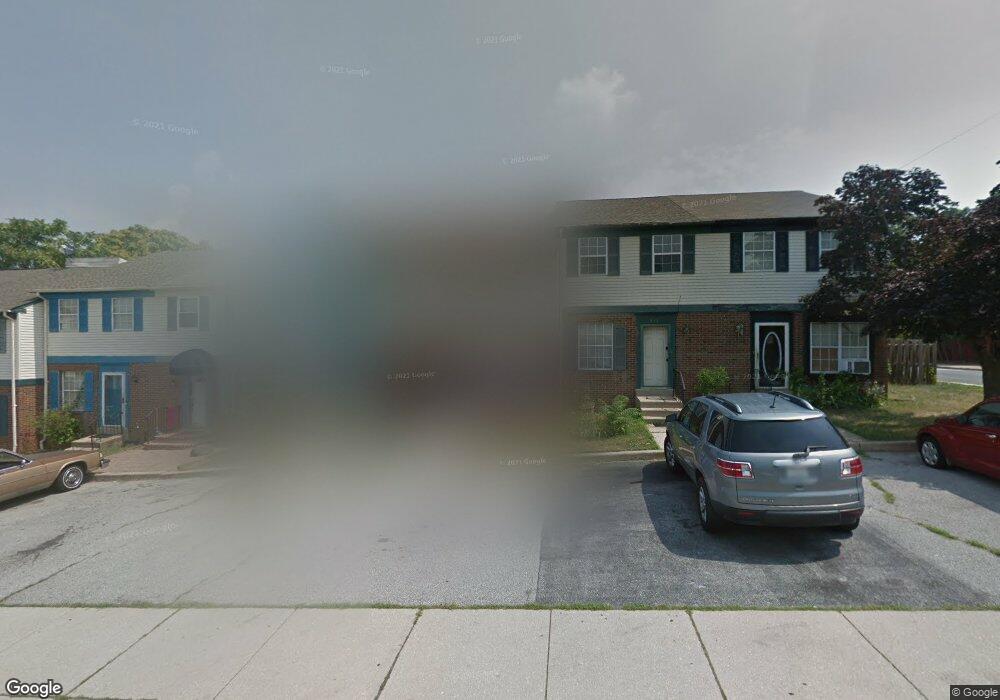
505 W 3rd St Wilmington, DE 19801
Downtown Wilmington NeighborhoodEstimated Value: $197,000 - $269,000
2
Beds
2
Baths
1,250
Sq Ft
$180/Sq Ft
Est. Value
About This Home
This home is located at 505 W 3rd St, Wilmington, DE 19801 and is currently estimated at $224,906, approximately $179 per square foot. 505 W 3rd St is a home located in New Castle County with nearby schools including The Bancroft School, The Bayard School, and Newark High School.
Ownership History
Date
Name
Owned For
Owner Type
Purchase Details
Closed on
Sep 30, 2008
Sold by
Va
Bought by
Masotti James G
Current Estimated Value
Home Financials for this Owner
Home Financials are based on the most recent Mortgage that was taken out on this home.
Original Mortgage
$77,165
Outstanding Balance
$51,104
Interest Rate
6.43%
Mortgage Type
VA
Estimated Equity
$173,802
Purchase Details
Closed on
Apr 12, 2007
Sold by
Tann Alonza E and Chase Manhattan Mortgage Corp
Bought by
Va
Create a Home Valuation Report for This Property
The Home Valuation Report is an in-depth analysis detailing your home's value as well as a comparison with similar homes in the area
Home Values in the Area
Average Home Value in this Area
Purchase History
| Date | Buyer | Sale Price | Title Company |
|---|---|---|---|
| Masotti James G | $77,168 | None Available | |
| Va | $102,756 | None Available |
Source: Public Records
Mortgage History
| Date | Status | Borrower | Loan Amount |
|---|---|---|---|
| Open | Masotti James G | $77,165 |
Source: Public Records
Tax History Compared to Growth
Tax History
| Year | Tax Paid | Tax Assessment Tax Assessment Total Assessment is a certain percentage of the fair market value that is determined by local assessors to be the total taxable value of land and additions on the property. | Land | Improvement |
|---|---|---|---|---|
| 2024 | $1,961 | $53,200 | $7,200 | $46,000 |
| 2023 | $1,912 | $53,200 | $7,200 | $46,000 |
| 2022 | $1,892 | $53,200 | $7,200 | $46,000 |
| 2021 | $1,844 | $53,200 | $7,200 | $46,000 |
| 2020 | $1,790 | $53,200 | $7,200 | $46,000 |
| 2019 | $1,061 | $53,200 | $7,200 | $46,000 |
| 2018 | $1,529 | $53,200 | $7,200 | $46,000 |
| 2017 | $1,484 | $53,200 | $7,200 | $46,000 |
| 2016 | $1,480 | $53,200 | $7,200 | $46,000 |
| 2015 | $2,311 | $53,200 | $7,200 | $46,000 |
| 2014 | $2,310 | $53,200 | $7,200 | $46,000 |
Source: Public Records
Map
Nearby Homes