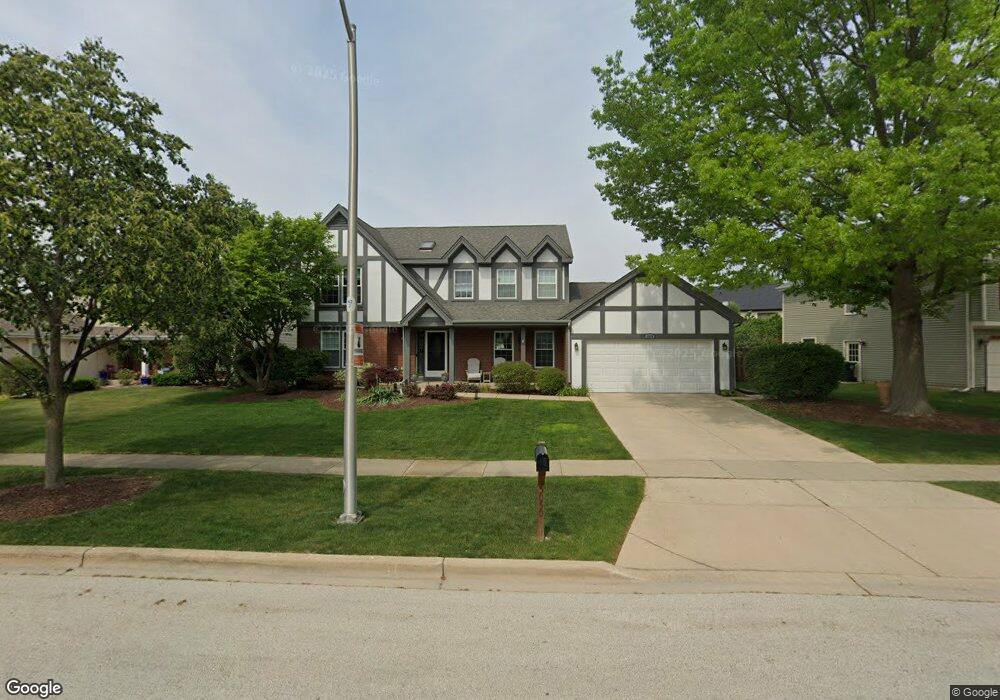
5050 Dukesberry Ln Hoffman Estates, IL 60010
South Ridge NeighborhoodEstimated Value: $518,426 - $580,000
4
Beds
2
Baths
2,292
Sq Ft
$235/Sq Ft
Est. Value
About This Home
This home is located at 5050 Dukesberry Ln, Hoffman Estates, IL 60010 and is currently estimated at $537,607, approximately $234 per square foot. 5050 Dukesberry Ln is a home located in Cook County with nearby schools including Frank C. Whiteley Elementary School, Plum Grove Jr High School, and William Fremd High School.
Ownership History
Date
Name
Owned For
Owner Type
Purchase Details
Closed on
Apr 11, 2018
Sold by
Priebe Michael J and Priebe Susan M
Bought by
Priebe Michael J and Priebe Susan M
Current Estimated Value
Purchase Details
Closed on
Feb 14, 1997
Sold by
Bossong Scott C and Bossong Kathleen G
Bought by
Priebe Michael J and Priebe Susan M
Home Financials for this Owner
Home Financials are based on the most recent Mortgage that was taken out on this home.
Original Mortgage
$150,000
Outstanding Balance
$17,511
Interest Rate
7.92%
Estimated Equity
$520,096
Purchase Details
Closed on
Jun 28, 1996
Sold by
Ziemba Donald J and Ziemba Marie K
Bought by
Bossong Scott C and Bossong Kathleen G
Home Financials for this Owner
Home Financials are based on the most recent Mortgage that was taken out on this home.
Original Mortgage
$191,000
Interest Rate
8.31%
Create a Home Valuation Report for This Property
The Home Valuation Report is an in-depth analysis detailing your home's value as well as a comparison with similar homes in the area
Home Values in the Area
Average Home Value in this Area
Purchase History
| Date | Buyer | Sale Price | Title Company |
|---|---|---|---|
| Priebe Michael J | -- | Attorney | |
| Priebe Michael J | $245,000 | -- | |
| Bossong Scott C | $247,000 | -- |
Source: Public Records
Mortgage History
| Date | Status | Borrower | Loan Amount |
|---|---|---|---|
| Open | Priebe Michael J | $150,000 | |
| Previous Owner | Bossong Scott C | $191,000 |
Source: Public Records
Tax History Compared to Growth
Tax History
| Year | Tax Paid | Tax Assessment Tax Assessment Total Assessment is a certain percentage of the fair market value that is determined by local assessors to be the total taxable value of land and additions on the property. | Land | Improvement |
|---|---|---|---|---|
| 2024 | $9,722 | $37,504 | $8,648 | $28,856 |
| 2023 | $10,705 | $39,361 | $8,648 | $30,713 |
| 2022 | $10,705 | $39,361 | $8,648 | $30,713 |
| 2021 | $10,227 | $33,697 | $5,147 | $28,550 |
| 2020 | $10,072 | $33,697 | $5,147 | $28,550 |
| 2019 | $9,925 | $37,235 | $5,147 | $32,088 |
| 2018 | $10,310 | $35,906 | $4,735 | $31,171 |
| 2017 | $11,009 | $38,725 | $4,735 | $33,990 |
| 2016 | $10,480 | $38,725 | $4,735 | $33,990 |
| 2015 | $10,585 | $36,612 | $4,323 | $32,289 |
| 2014 | $10,402 | $36,612 | $4,323 | $32,289 |
| 2013 | $10,984 | $39,547 | $4,323 | $35,224 |
Source: Public Records
Map
Nearby Homes
- 5015 Rochester Dr
- 4850 Prestwick Place
- 4890 Prestwick Place
- 4944 Somerton Dr
- 5190 Chambers Dr
- 4827 Turnberry Dr
- 4797 Amber Cir
- 4760 Amber Cir
- 2022 Abbotsford Dr
- 4658 Burnham Dr
- 5070 Thornbark Dr
- 1208 Old Timber Ln
- 1404 W Sapphire Dr
- 13 Chipping Campden Dr
- 1195 Old Timber Ct
- 2204 Shetland Rd
- 121 Florence Ave
- 1560 Macalpin Cir
- 1100 Macalpin Dr
- 61 E Palatine Rd
- 5040 Dukesberry Ln
- 5070 Dukesberry Ln
- 5055 Castaway Ln
- 5065 Castaway Ln
- 5045 Castaway Ln
- 5090 Dukesberry Ln
- 5055 Dukesberry Ln
- 5045 Dukesberry Ln
- 5065 Dukesberry Ln
- 5035 Castaway Ln
- 5075 Dukesberry Ln
- 5020 Dukesberry Ln
- 5035 Dukesberry Ln
- 5025 Castaway Ln
- 5031 Dukesberry Ln
- 5095 Dukesberry Ln
- 5010 Dukesberry Ln Unit II
- 5060 Castaway Ln
- 5050 Castaway Ln
- 5015 Castaway Ln