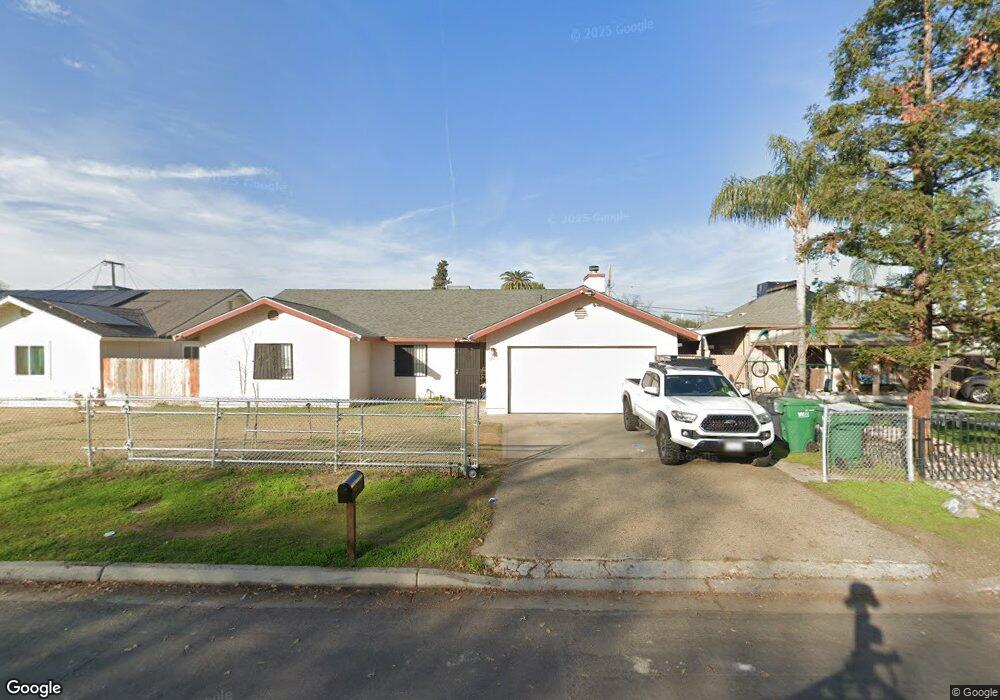
5057 E Huntington Ave Fresno, CA 93727
Sunnyside NeighborhoodEstimated Value: $316,000 - $392,000
5
Beds
2
Baths
1,702
Sq Ft
$209/Sq Ft
Est. Value
About This Home
This home is located at 5057 E Huntington Ave, Fresno, CA 93727 and is currently estimated at $355,427, approximately $208 per square foot. 5057 E Huntington Ave is a home located in Fresno County with nearby schools including David L. Greenberg Elementary School, Kings Canyon Middle School, and Sunnyside High School.
Ownership History
Date
Name
Owned For
Owner Type
Purchase Details
Closed on
Apr 3, 2017
Sold by
Yang Youa Za and Cha Neng
Bought by
Yang Youa Za and Cha Neng
Current Estimated Value
Purchase Details
Closed on
Nov 6, 2000
Sold by
See Yang
Bought by
Yang Youa Za and Cha Neng
Purchase Details
Closed on
Feb 12, 1999
Sold by
Washington Mutual Bank Fa
Bought by
Yang See
Home Financials for this Owner
Home Financials are based on the most recent Mortgage that was taken out on this home.
Original Mortgage
$43,200
Interest Rate
6.73%
Mortgage Type
Stand Alone First
Purchase Details
Closed on
Jun 11, 1998
Sold by
Higano Talanoa and Higano Janice C
Bought by
Washington Mutual Bank Fa
Purchase Details
Closed on
Mar 22, 1996
Sold by
Talanoa Higano and Talanoa Janice C
Bought by
Talanoa Higano
Create a Home Valuation Report for This Property
The Home Valuation Report is an in-depth analysis detailing your home's value as well as a comparison with similar homes in the area
Home Values in the Area
Average Home Value in this Area
Purchase History
| Date | Buyer | Sale Price | Title Company |
|---|---|---|---|
| Yang Youa Za | -- | None Available | |
| Yang Youa Za | -- | -- | |
| Yang See | $54,000 | Fidelity National Title Co | |
| Washington Mutual Bank Fa | $35,615 | Fidelity National Title Ins | |
| Talanoa Higano | -- | -- |
Source: Public Records
Mortgage History
| Date | Status | Borrower | Loan Amount |
|---|---|---|---|
| Previous Owner | Yang See | $43,200 |
Source: Public Records
Tax History Compared to Growth
Tax History
| Year | Tax Paid | Tax Assessment Tax Assessment Total Assessment is a certain percentage of the fair market value that is determined by local assessors to be the total taxable value of land and additions on the property. | Land | Improvement |
|---|---|---|---|---|
| 2025 | $1,070 | $84,623 | $25,068 | $59,555 |
| 2023 | $1,050 | $81,340 | $24,096 | $57,244 |
| 2022 | $1,037 | $79,746 | $23,624 | $56,122 |
| 2021 | $1,009 | $78,183 | $23,161 | $55,022 |
| 2020 | $1,005 | $77,382 | $22,924 | $54,458 |
| 2019 | $967 | $75,866 | $22,475 | $53,391 |
| 2018 | $947 | $74,380 | $22,035 | $52,345 |
| 2017 | $931 | $72,922 | $21,603 | $51,319 |
| 2016 | $902 | $71,493 | $21,180 | $50,313 |
| 2015 | $888 | $70,420 | $20,862 | $49,558 |
| 2014 | $870 | $69,042 | $20,454 | $48,588 |
Source: Public Records
Map
Nearby Homes
- 5160 E Balch Ave
- 4918 E Illinois Ave
- 5145 E Lane Ave Unit 252
- 5023 E Lane Ave
- 4983 E Grant Ave
- 225 S Dearing Ave
- 4923 E Grant Ave
- 4975 E Butler Ave Unit 131
- 1190 S Winery Ave Unit 284
- 4985 E Butler Ave Unit 109
- 4752 E Kerckhoff Ave
- 1151 S Chestnut Ave Unit 237
- 1151 S Chestnut Ave Unit 127
- 1151 S Chestnut Ave Unit 215
- 1151 S Chestnut Ave Unit 108
- 4749 E Montecito Ave
- 4871 E Butler Ave Unit 102
- 5221 E Townsend Ave
- 605 N Winery Ave
- 5407 E Tulare St
- 5053 E Huntington Ave
- 5061 E Huntington Ave
- 5056 E Laurel Ave
- 5069 E Huntington Ave
- 5052 E Laurel Ave
- 5060 E Laurel Ave
- 5043 E Huntington Ave
- 5048 E Laurel Ave
- 5064 E Laurel Ave
- 5042 E Laurel Ave
- 5070 E Laurel Ave
- 5046 E Huntington Ave
- 5044 E Huntington Ave
- 5038 E Laurel Ave
- 5074 E Laurel Ave
- 5037 E Huntington Ave
- 5038 E Huntington Ave
- 5085 E Huntington Ave
- 5057 E Laurel Ave
- 5065 E Laurel Ave