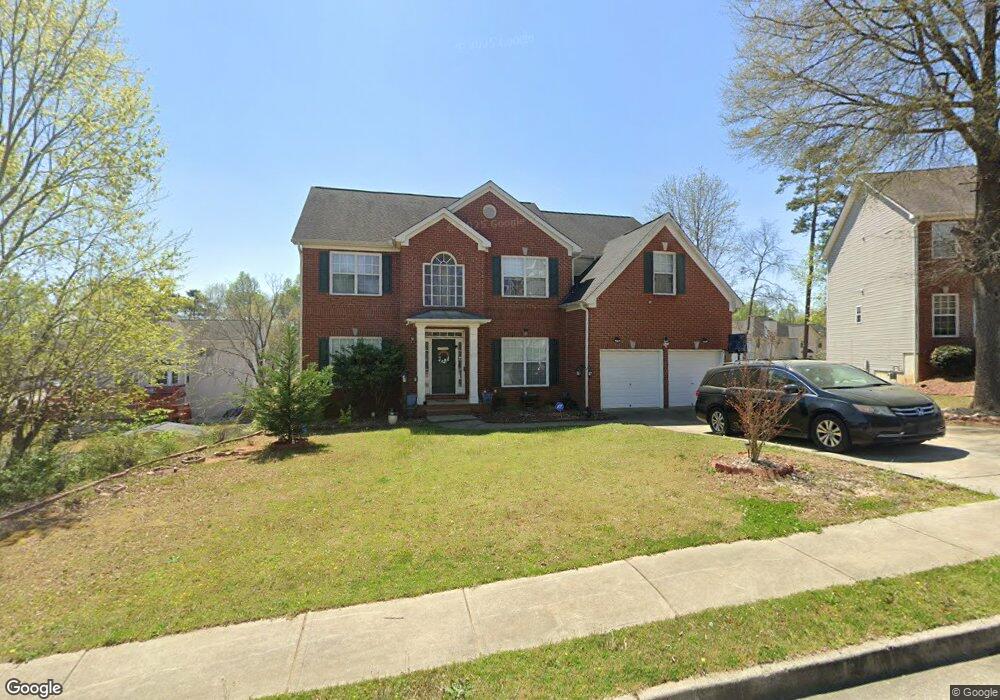
506 Bruin Ct Stockbridge, GA 30281
Estimated Value: $382,000 - $413,710
4
Beds
3
Baths
3,048
Sq Ft
$130/Sq Ft
Est. Value
About This Home
This home is located at 506 Bruin Ct, Stockbridge, GA 30281 and is currently estimated at $396,428, approximately $130 per square foot. 506 Bruin Ct is a home located in Henry County with nearby schools including Red Oak Elementary School, Dutchtown Middle School, and Dutchtown High School.
Ownership History
Date
Name
Owned For
Owner Type
Purchase Details
Closed on
Nov 1, 2018
Sold by
Kala Rajinder
Bought by
Zamor Ginette T
Current Estimated Value
Home Financials for this Owner
Home Financials are based on the most recent Mortgage that was taken out on this home.
Original Mortgage
$175,200
Outstanding Balance
$152,147
Interest Rate
4.7%
Mortgage Type
New Conventional
Estimated Equity
$244,281
Purchase Details
Closed on
Nov 20, 2001
Sold by
Mccar Dev Corp
Bought by
Kala Rajinder and Kala Kulvinder
Home Financials for this Owner
Home Financials are based on the most recent Mortgage that was taken out on this home.
Original Mortgage
$172,800
Interest Rate
6.42%
Mortgage Type
New Conventional
Purchase Details
Closed on
Apr 24, 2001
Sold by
Hayes Assoc Llc
Bought by
Olde Towne Builders Inc
Home Financials for this Owner
Home Financials are based on the most recent Mortgage that was taken out on this home.
Original Mortgage
$100,425
Interest Rate
6.9%
Mortgage Type
New Conventional
Create a Home Valuation Report for This Property
The Home Valuation Report is an in-depth analysis detailing your home's value as well as a comparison with similar homes in the area
Home Values in the Area
Average Home Value in this Area
Purchase History
| Date | Buyer | Sale Price | Title Company |
|---|---|---|---|
| Zamor Ginette T | $219,000 | -- | |
| Kala Rajinder | $216,000 | -- | |
| Olde Towne Builders Inc | $24,000 | -- |
Source: Public Records
Mortgage History
| Date | Status | Borrower | Loan Amount |
|---|---|---|---|
| Open | Zamor Ginette T | $175,200 | |
| Previous Owner | Kala Rajinder | $172,800 | |
| Previous Owner | Olde Towne Builders Inc | $100,425 |
Source: Public Records
Tax History Compared to Growth
Tax History
| Year | Tax Paid | Tax Assessment Tax Assessment Total Assessment is a certain percentage of the fair market value that is determined by local assessors to be the total taxable value of land and additions on the property. | Land | Improvement |
|---|---|---|---|---|
| 2025 | $6,751 | $166,080 | $18,000 | $148,080 |
| 2024 | $6,751 | $166,840 | $18,000 | $148,840 |
| 2023 | $6,940 | $166,480 | $14,000 | $152,480 |
| 2022 | $5,243 | $130,560 | $14,000 | $116,560 |
| 2021 | $4,143 | $101,680 | $12,000 | $89,680 |
| 2020 | $4,079 | $100,000 | $10,000 | $90,000 |
| 2019 | $3,539 | $87,600 | $9,986 | $77,614 |
| 2018 | $3,034 | $81,480 | $10,000 | $71,480 |
| 2016 | $2,768 | $74,560 | $9,200 | $65,360 |
| 2015 | $2,500 | $65,960 | $7,200 | $58,760 |
| 2014 | $2,460 | $64,360 | $6,000 | $58,360 |
Source: Public Records
Map
Nearby Homes
- 568 Ransom Way
- 117 Titan Rd
- 705 Brentwood Pkwy
- 512 Chaucer Way Unit 1
- 200 Ernestine Way
- 263 Northwind Dr
- 404 Northwind Place
- 213 Sunderland Way Unit 1
- 223 Monarch Village Way
- 602 Brookwater Dr
- 300 Monarch Village Way
- 623 Brookwater Dr
- 266 Monarch Village Way
- 540 Anglewood Trace
- 1341 Kent Manor Unit 3
- 328 Spring Creek Dr
- 687 Pathwood Ln
- 719 Nightwind Way
- 469 Village Cir
- 508 Bruin Ct
- 504 Bruin Ct
- 259 Lakeview Place Unit 1
- 263 Lakeview Place
- 263R Lakeview Place
- 503 Bruin Ct
- 255 Lakeview Place
- 255 Lakeview Place Unit 36
- 502 Bruin Ct
- 510 Bruin Ct
- 501 Bruin Ct
- 501 Bruin Ct Unit 32
- 0 Bruin Ct Unit 8417762
- 0 Bruin Ct Unit 8171688
- 0 Bruin Ct Unit 7255453
- 505 Bruin Ct
- 251 Lakeview Place Unit 1
- 500 Bruin Ct
- 267 Lakeview Place
- 128 Whitaker Dr