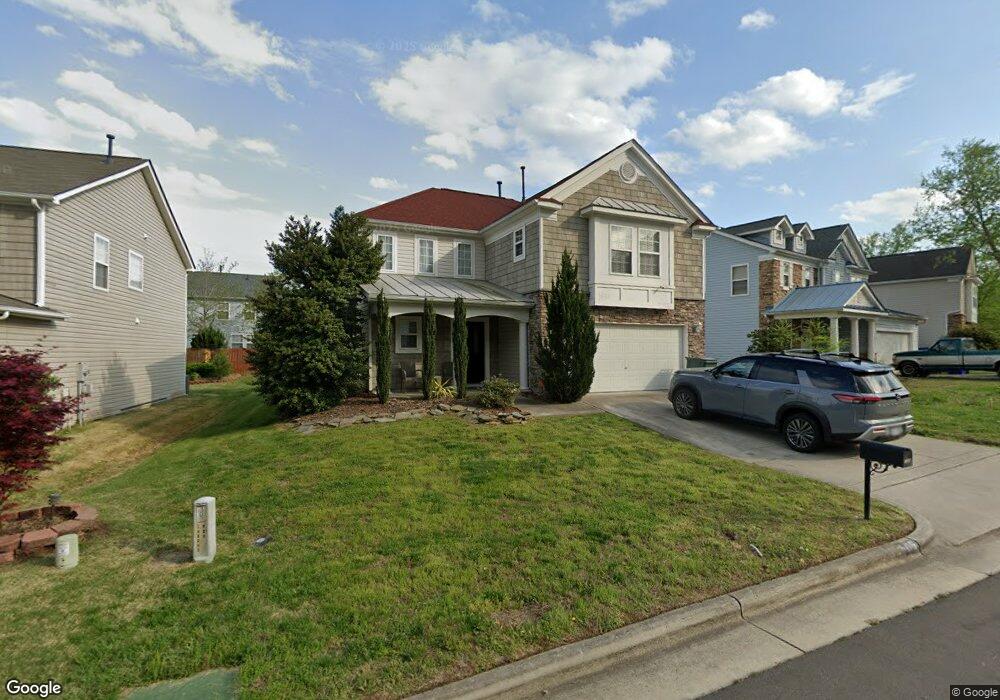
506 Pebblestone Dr Durham, NC 27703
Eastern Durham NeighborhoodEstimated Value: $346,074 - $391,000
3
Beds
3
Baths
1,895
Sq Ft
$193/Sq Ft
Est. Value
About This Home
This home is located at 506 Pebblestone Dr, Durham, NC 27703 and is currently estimated at $365,019, approximately $192 per square foot. 506 Pebblestone Dr is a home located in Durham County with nearby schools including Glenn Elementary, John W Neal Middle School, and Southern School of Energy & Sustainability.
Ownership History
Date
Name
Owned For
Owner Type
Purchase Details
Closed on
May 28, 2019
Sold by
Equity Trust Company
Bought by
Yerace Thomas Joseph and Yerace Yan Yang
Current Estimated Value
Home Financials for this Owner
Home Financials are based on the most recent Mortgage that was taken out on this home.
Original Mortgage
$150,000
Outstanding Balance
$98,418
Interest Rate
4.1%
Mortgage Type
New Conventional
Estimated Equity
$266,601
Purchase Details
Closed on
Mar 22, 2019
Sold by
Webb Antwone
Bought by
Akamai Investments Llc and Equity Trust Company
Purchase Details
Closed on
Sep 30, 2004
Sold by
Kb Home Raleigh Durham Llc
Bought by
Webb Antwone
Home Financials for this Owner
Home Financials are based on the most recent Mortgage that was taken out on this home.
Original Mortgage
$148,849
Interest Rate
5.75%
Mortgage Type
FHA
Create a Home Valuation Report for This Property
The Home Valuation Report is an in-depth analysis detailing your home's value as well as a comparison with similar homes in the area
Home Values in the Area
Average Home Value in this Area
Purchase History
| Date | Buyer | Sale Price | Title Company |
|---|---|---|---|
| Yerace Thomas Joseph | $239,000 | None Available | |
| Akamai Investments Llc | $165,500 | None Available | |
| Webb Antwone | $150,500 | -- |
Source: Public Records
Mortgage History
| Date | Status | Borrower | Loan Amount |
|---|---|---|---|
| Open | Yerace Thomas Joseph | $150,000 | |
| Previous Owner | Webb Antwone | $148,849 |
Source: Public Records
Tax History
| Year | Tax Paid | Tax Assessment Tax Assessment Total Assessment is a certain percentage of the fair market value that is determined by local assessors to be the total taxable value of land and additions on the property. | Land | Improvement |
|---|---|---|---|---|
| 2025 | $3,508 | $353,882 | $70,625 | $283,257 |
| 2024 | $2,478 | $177,679 | $33,960 | $143,719 |
| 2023 | $2,327 | $177,679 | $33,960 | $143,719 |
| 2022 | $2,274 | $177,679 | $33,960 | $143,719 |
| 2021 | $2,263 | $177,679 | $33,960 | $143,719 |
| 2020 | $2,210 | $177,679 | $33,960 | $143,719 |
| 2019 | $2,210 | $177,679 | $33,960 | $143,719 |
| 2018 | $2,102 | $154,942 | $28,300 | $126,642 |
| 2017 | $2,086 | $154,942 | $28,300 | $126,642 |
| 2016 | $2,016 | $154,942 | $28,300 | $126,642 |
| 2015 | $2,276 | $164,411 | $30,360 | $134,051 |
| 2014 | $2,276 | $164,411 | $30,360 | $134,051 |
Source: Public Records
Map
Nearby Homes
- 509 Pebblestone Dr
- 409 Magna Dr
- 1034 Statler Dr
- 1217 Golden Eagle Dr
- 110 Rosebud Ln
- 3721 Brightwood Ln
- 1201 Opal Ln
- 1106 Red Crest Ln
- 1209 Opal Ln
- 608 Clearfield Dr
- 1213 Opal Ln
- 510 Cove Hollow Dr
- 1060 Gentle Reed Dr
- 1828 Fletchers Chapel Rd
- 1742 Fletchers Chapel Rd
- 7 Duxford Ct
- 2 Tarrywood Ct
- 1143 Sweet Cream Ct
- 1113 Kindness Ln
- 407 Kinnakeet Dr
- 504 Pebblestone Dr
- 508 Pebblestone Dr
- 503 Magna Dr
- 505 Magna Dr
- 510 Pebblestone Dr
- 502 Pebblestone Dr
- 501 Magna Dr
- 507 Magna Dr
- 512 Pebblestone Dr
- 507 Pebblestone Dr
- 509 Magna Dr
- 511 Pebblestone Dr
- 505 Pebblestone Dr
- 503 Pebblestone Dr
- 513 Pebblestone Dr
- 514 Pebblestone Dr
- 501 Pebblestone Dr
- 414 Pebblestone Dr
- 515 Pebblestone Dr
- 506 Magna Dr
Your Personal Tour Guide
Ask me questions while you tour the home.