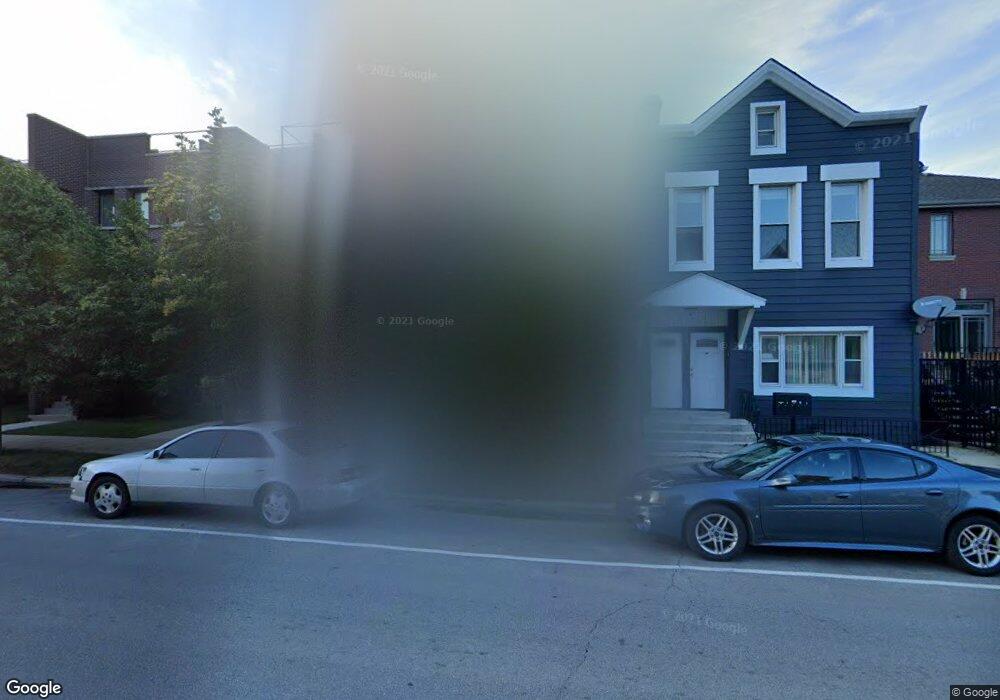
506 W 33rd St Chicago, IL 60616
Bridgeport NeighborhoodEstimated Value: $331,000 - $847,000
3
Beds
4
Baths
2,500
Sq Ft
$278/Sq Ft
Est. Value
About This Home
This home is located at 506 W 33rd St, Chicago, IL 60616 and is currently estimated at $693,798, approximately $277 per square foot. 506 W 33rd St is a home located in Cook County with nearby schools including Healy Elementary School, Bridgeport Catholic Academy - South Campus, and Youth Connection Charter School.
Ownership History
Date
Name
Owned For
Owner Type
Purchase Details
Closed on
Jul 21, 2014
Sold by
Awtry Mason
Bought by
Wu Raymond L and Wu Pamela Y
Current Estimated Value
Home Financials for this Owner
Home Financials are based on the most recent Mortgage that was taken out on this home.
Original Mortgage
$397,800
Outstanding Balance
$302,550
Interest Rate
4.12%
Mortgage Type
New Conventional
Estimated Equity
$391,248
Purchase Details
Closed on
Apr 7, 2008
Sold by
Beilin Marnie
Bought by
Awtry Mason
Purchase Details
Closed on
Jun 5, 2007
Sold by
33Rd Street Square Llc
Bought by
Beilin Marnie and Awtry Mason
Home Financials for this Owner
Home Financials are based on the most recent Mortgage that was taken out on this home.
Original Mortgage
$506,204
Interest Rate
6.2%
Mortgage Type
Unknown
Purchase Details
Closed on
Dec 11, 1998
Sold by
Kwong Yu Yuk
Bought by
Mmt Investments Inc
Create a Home Valuation Report for This Property
The Home Valuation Report is an in-depth analysis detailing your home's value as well as a comparison with similar homes in the area
Home Values in the Area
Average Home Value in this Area
Purchase History
| Date | Buyer | Sale Price | Title Company |
|---|---|---|---|
| Wu Raymond L | $468,000 | None Available | |
| Awtry Mason | -- | Chicago Title Insurance Co | |
| Beilin Marnie | $634,500 | Multiple | |
| Mmt Investments Inc | $108,000 | -- |
Source: Public Records
Mortgage History
| Date | Status | Borrower | Loan Amount |
|---|---|---|---|
| Open | Wu Raymond L | $397,800 | |
| Previous Owner | Beilin Marnie | $506,204 |
Source: Public Records
Tax History Compared to Growth
Tax History
| Year | Tax Paid | Tax Assessment Tax Assessment Total Assessment is a certain percentage of the fair market value that is determined by local assessors to be the total taxable value of land and additions on the property. | Land | Improvement |
|---|---|---|---|---|
| 2024 | $10,483 | $63,000 | $7,565 | $55,435 |
| 2023 | $10,197 | $53,000 | $6,107 | $46,893 |
| 2022 | $10,197 | $53,000 | $6,107 | $46,893 |
| 2021 | $9,988 | $52,999 | $6,107 | $46,892 |
| 2020 | $11,097 | $52,915 | $6,107 | $46,808 |
| 2019 | $11,256 | $59,456 | $6,107 | $53,349 |
| 2018 | $11,066 | $59,456 | $6,107 | $53,349 |
| 2017 | $9,520 | $47,598 | $4,858 | $42,740 |
| 2016 | $9,033 | $47,598 | $4,858 | $42,740 |
| 2015 | $8,241 | $47,598 | $4,858 | $42,740 |
| 2014 | $8,759 | $47,211 | $4,164 | $43,047 |
| 2013 | $8,586 | $47,211 | $4,164 | $43,047 |
Source: Public Records
Map
Nearby Homes
- 3246 S Normal Ave
- 3214 S Canal St
- 3322 S Parnell Ave
- 3120 S Normal Ave
- 3315 S Lowe Ave
- 3234 S Princeton Ave
- 3212 S Union Ave
- 3148 S Union Ave
- 3405 S Union Ave
- 3247 S Emerald Ave
- 3505 S Parnell Ave Unit D
- 3106 S Wells St Unit 1
- 3106 S Wells St Unit 3
- 3357 S Emerald Ave
- 238 W 31st St Unit 2E
- 238 W 31st St Unit 4W
- 714 W 31st St
- 3028 S Union Ave
- 3549 S Lowe Ave
- 3011 S Emerald Ave
- 506 W 33rd St
- 506 W 33rd St
- 504 W 33rd St
- 504 W 33rd St
- 510 W 33rd St
- 510 W 33rd St
- 510 W 33rd St
- 510 W 33rd St Unit 510
- 508 W 33rd St
- 512 W 33rd St
- 512 W 33rd St Unit 512
- 514 W 33rd St
- 516 W 33rd St
- 3246 S Normal Ave Unit 1
- 518 W 33rd St
- 3251 S Parnell Ave
- 3242 S Normal Ave
- 3300 S Normal Ave
- 520 W 33rd St Unit 520
- 3240 S Normal Ave