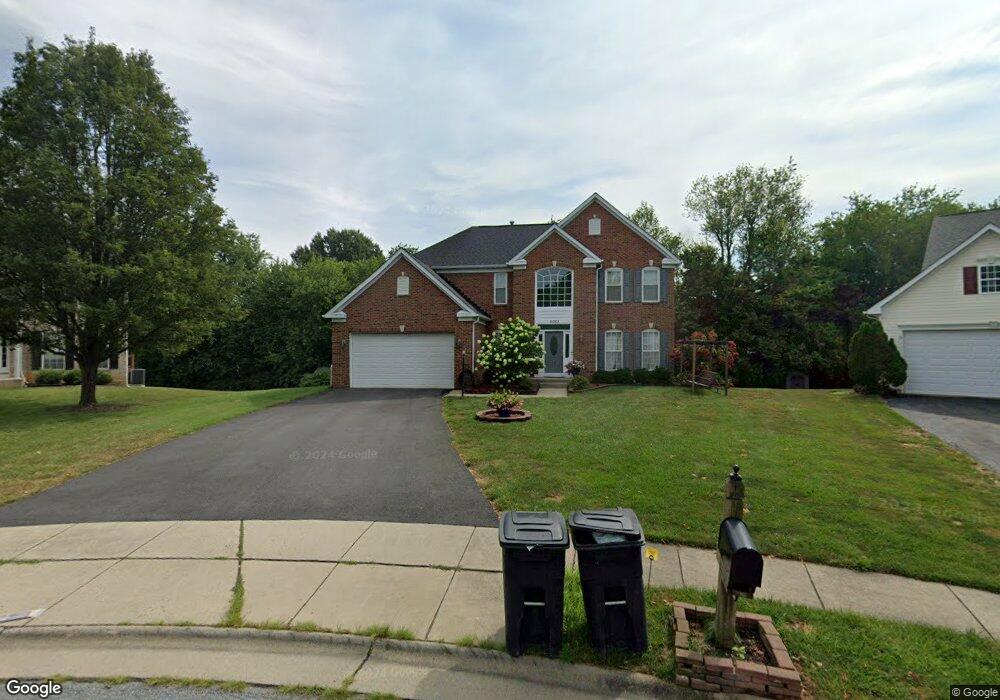
5065 Croydon Ct Frederick, MD 21703
Estimated Value: $653,000 - $696,000
Studio
4
Baths
2,804
Sq Ft
$240/Sq Ft
Est. Value
About This Home
This home is located at 5065 Croydon Ct, Frederick, MD 21703 and is currently estimated at $672,677, approximately $239 per square foot. 5065 Croydon Ct is a home located in Frederick County with nearby schools including Tuscarora Elementary School, Crestwood Middle, and Tuscarora High School.
Ownership History
Date
Name
Owned For
Owner Type
Purchase Details
Closed on
Feb 3, 2010
Sold by
Molina Jose and Molina Elsie
Bought by
Molina Tiffany L and Molina Charles
Current Estimated Value
Purchase Details
Closed on
Jan 7, 2005
Sold by
Plaza Bethany J
Bought by
Molina Jose and Molina Elsie
Purchase Details
Closed on
Aug 23, 2000
Sold by
Nvr Inc
Bought by
Plaza Bethany J
Purchase Details
Closed on
Mar 10, 2000
Sold by
Wellington Land Holdings Llc
Bought by
Nvr Inc
Create a Home Valuation Report for This Property
The Home Valuation Report is an in-depth analysis detailing your home's value as well as a comparison with similar homes in the area
Home Values in the Area
Average Home Value in this Area
Purchase History
We collect this data history from publicly available records. To have your information removed, we recommend requesting removal directly through your county’s website.
| Date | Buyer | Sale Price | Title Company |
|---|---|---|---|
| Molina Tiffany L | $415,000 | -- | |
| Molina Jose | $500,000 | -- | |
| Plaza Bethany J | $291,649 | -- | |
| Nvr Inc | $61,284 | -- |
Source: Public Records
Mortgage History
We collect this data history from publicly available records. To have your information removed, we recommend requesting removal directly through your county’s website.
| Date | Status | Borrower | Loan Amount |
|---|---|---|---|
| Closed | Molina Tiffany L | -- |
Source: Public Records
Tax History
| Year | Tax Paid | Tax Assessment Tax Assessment Total Assessment is a certain percentage of the fair market value that is determined by local assessors to be the total taxable value of land and additions on the property. | Land | Improvement |
|---|---|---|---|---|
| 2025 | $6,094 | $546,867 | -- | -- |
| 2024 | $6,094 | $496,000 | $104,000 | $392,000 |
| 2023 | $5,594 | $474,100 | $0 | $0 |
| 2022 | $5,336 | $452,200 | $0 | $0 |
| 2021 | $5,058 | $430,300 | $90,400 | $339,900 |
| 2020 | $5,058 | $427,900 | $0 | $0 |
| 2019 | $5,030 | $425,500 | $0 | $0 |
| 2018 | $5,047 | $423,100 | $90,400 | $332,700 |
| 2017 | $4,830 | $423,100 | $0 | $0 |
| 2016 | $4,924 | $393,500 | $0 | $0 |
| 2015 | $4,924 | $378,700 | $0 | $0 |
| 2014 | $4,924 | $378,700 | $0 | $0 |
Source: Public Records
Map
Nearby Homes
- 6622 Gooseander Ct
- 5132 Dartmoor Place
- 6660 Seagull Ct
- 5136 Charlington Ct
- 5086 Stapleton Terrace
- 6726 Killdeer Ct
- 5168 Tiverton Ct
- 4946 Whitney Terrace
- 6642 Mcgrath Place
- 5066 Merganser Ct
- 6604 River Birch Rd
- 6638 Ballenger Run Blvd
- 5021 Mallard Ln
- 6571 Autumn Olive Dr
- 6393 Betty Linton Ln
- 5037 Small Gains Way
- 6490 Calverton Dr Unit 201
- 6490 Calverton Dr Unit M304
- 6424 Alan Linton Blvd E
- 6511 Walcott Ln Unit 202
- 5063 Croydon Ct
- 5066 Croydon Ct
- 5061 Croydon Ct
- 5064 Croydon Ct
- 6610 Eider Ct
- 6630 Gooseander Ct
- 6628 Gooseander Ct
- 5062 Croydon Ct
- 5090 Reigate Ct
- 5059 Croydon Ct
- 6609 Eider Ct
- 5088 Reigate Ct
- 5060 Croydon Ct
- 6626 Gooseander Ct
- 6608 Eider Ct
- 5019 Saint Simon Ct
- 6340 Lysander Ct
- 6629 Gooseander Ct
- 5017 Saint Simon Ct
- 5057 Croydon Ct
Your Personal Tour Guide
Ask me questions while you tour the home.