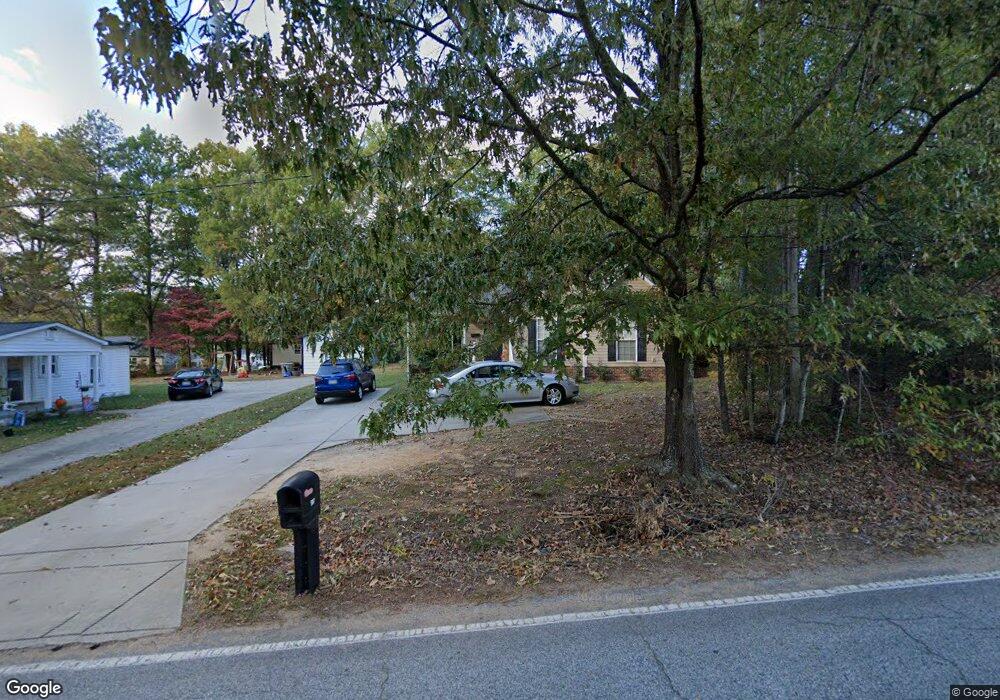
507 E 22nd St Kannapolis, NC 28083
Estimated Value: $281,000 - $294,170
Studio
2
Baths
1,403
Sq Ft
$203/Sq Ft
Est. Value
About This Home
This home is located at 507 E 22nd St, Kannapolis, NC 28083 and is currently estimated at $284,793, approximately $202 per square foot. 507 E 22nd St is a home located in Rowan County with nearby schools including Landis Elementary School, Corriher Lipe Middle School, and South Rowan High School.
Ownership History
Date
Name
Owned For
Owner Type
Purchase Details
Closed on
Sep 26, 2007
Sold by
Smith Jason F and Taylor Smith Amy C
Bought by
Wojciechowski Louis John
Current Estimated Value
Home Financials for this Owner
Home Financials are based on the most recent Mortgage that was taken out on this home.
Original Mortgage
$112,050
Outstanding Balance
$71,266
Interest Rate
6.57%
Mortgage Type
Unknown
Estimated Equity
$213,527
Purchase Details
Closed on
Oct 20, 2006
Sold by
White Stella C and White Dennis L
Bought by
Smith Jason F and Taylor Smith Amy C
Create a Home Valuation Report for This Property
The Home Valuation Report is an in-depth analysis detailing your home's value as well as a comparison with similar homes in the area
Home Values in the Area
Average Home Value in this Area
Purchase History
| Date | Buyer | Sale Price | Title Company |
|---|---|---|---|
| Wojciechowski Louis John | $124,500 | None Available | |
| Smith Jason F | -- | None Available |
Source: Public Records
Mortgage History
| Date | Status | Borrower | Loan Amount |
|---|---|---|---|
| Open | Wojciechowski Louis John | $112,050 |
Source: Public Records
Tax History
| Year | Tax Paid | Tax Assessment Tax Assessment Total Assessment is a certain percentage of the fair market value that is determined by local assessors to be the total taxable value of land and additions on the property. | Land | Improvement |
|---|---|---|---|---|
| 2025 | $2,686 | $221,943 | $22,500 | $199,443 |
| 2024 | $2,686 | $221,943 | $22,500 | $199,443 |
| 2023 | $2,686 | $221,943 | $22,500 | $199,443 |
| 2022 | $1,771 | $137,553 | $18,750 | $118,803 |
| 2021 | $1,771 | $137,553 | $18,750 | $118,803 |
| 2020 | $1,771 | $137,553 | $18,750 | $118,803 |
| 2019 | $1,771 | $137,553 | $18,750 | $118,803 |
| 2018 | $1,488 | $116,874 | $18,750 | $98,124 |
| 2017 | $1,488 | $116,874 | $18,750 | $98,124 |
| 2016 | $1,488 | $116,874 | $18,750 | $98,124 |
| 2015 | $1,511 | $116,874 | $18,750 | $98,124 |
| 2014 | $1,441 | $115,274 | $17,250 | $98,024 |
Source: Public Records
Map
Nearby Homes
- 494 E 22nd St
- 00 E 22nd St
- 408 E 22nd St
- 323 E 20th St
- 2210 N Cannon Blvd
- 400 E 27th St
- 0 Ebenezer Rd
- 1021 Ebenezer Rd
- 00 Ebenezer Rd
- 2003 Plaza Ave
- 2410 Summit Ave
- 2809 N Main St
- 513 Sand Dunes Dr
- 286 W 18th St
- 292 W 18th St
- 252 W 18th St
- 537 Sand Dunes Dr
- 310 W 18th St
- 526 Sand Dunes Dr
- 221 W 18th St
Your Personal Tour Guide
Ask me questions while you tour the home.