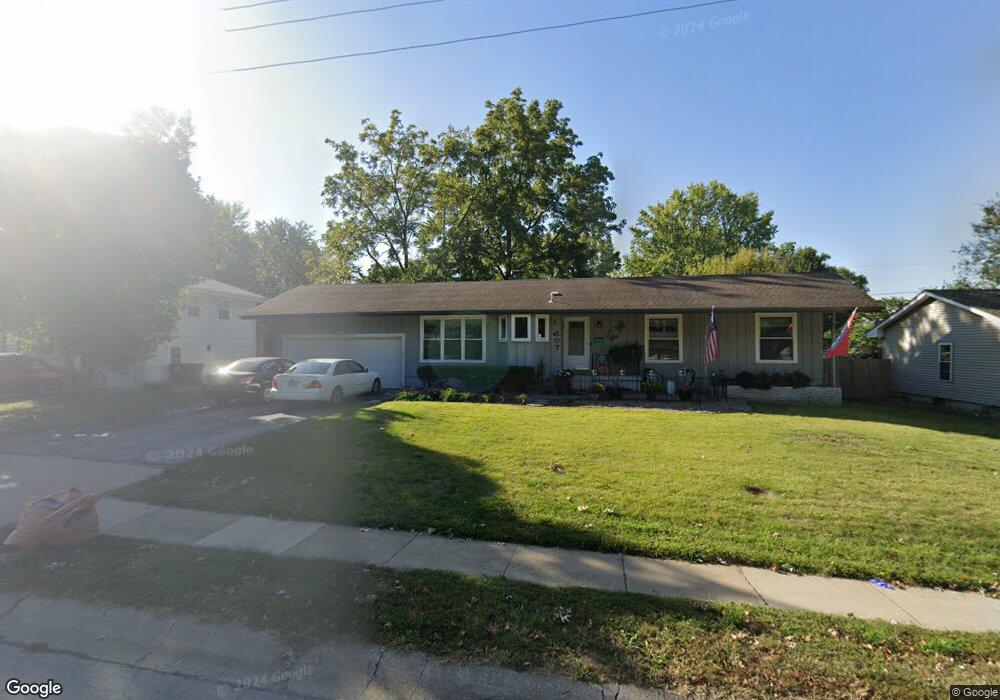
507 NW Obrien Rd Lees Summit, MO 64063
Estimated Value: $275,000 - $288,000
3
Beds
3
Baths
1,276
Sq Ft
$222/Sq Ft
Est. Value
About This Home
This home is located at 507 NW Obrien Rd, Lees Summit, MO 64063 and is currently estimated at $282,989, approximately $221 per square foot. 507 NW Obrien Rd is a home located in Jackson County with nearby schools including Westview Elementary School, Pleasant Lea Middle School, and Lee's Summit Senior High School.
Ownership History
Date
Name
Owned For
Owner Type
Purchase Details
Closed on
Dec 26, 2013
Sold by
Davis Lee Ann Renee and Davis Roger P
Bought by
Davis Roger P
Current Estimated Value
Home Financials for this Owner
Home Financials are based on the most recent Mortgage that was taken out on this home.
Original Mortgage
$115,550
Outstanding Balance
$86,874
Interest Rate
4.36%
Mortgage Type
New Conventional
Estimated Equity
$196,115
Purchase Details
Closed on
Jan 21, 2011
Sold by
Brockman Lee Ann Renee and Davis Roger P
Bought by
Davis Lee Ann Renee and Davis Roger P
Home Financials for this Owner
Home Financials are based on the most recent Mortgage that was taken out on this home.
Original Mortgage
$117,800
Interest Rate
4.84%
Mortgage Type
New Conventional
Purchase Details
Closed on
Aug 25, 2006
Sold by
Riddle Joe E and Riddle Dolores
Bought by
Brockman Lee Ann Renee
Home Financials for this Owner
Home Financials are based on the most recent Mortgage that was taken out on this home.
Original Mortgage
$123,384
Interest Rate
6.75%
Mortgage Type
Purchase Money Mortgage
Create a Home Valuation Report for This Property
The Home Valuation Report is an in-depth analysis detailing your home's value as well as a comparison with similar homes in the area
Home Values in the Area
Average Home Value in this Area
Purchase History
| Date | Buyer | Sale Price | Title Company |
|---|---|---|---|
| Davis Roger P | -- | Truhome Title Solutions Llc | |
| Davis Lee Ann Renee | -- | Truhome Title Solutions | |
| Brockman Lee Ann Renee | -- | First American Title Company |
Source: Public Records
Mortgage History
| Date | Status | Borrower | Loan Amount |
|---|---|---|---|
| Open | Davis Roger P | $115,550 | |
| Closed | Davis Lee Ann Renee | $117,800 | |
| Closed | Brockman Lee Ann Renee | $123,384 |
Source: Public Records
Tax History
| Year | Tax Paid | Tax Assessment Tax Assessment Total Assessment is a certain percentage of the fair market value that is determined by local assessors to be the total taxable value of land and additions on the property. | Land | Improvement |
|---|---|---|---|---|
| 2025 | $3,224 | $32,414 | $9,194 | $23,220 |
| 2024 | $3,201 | $44,650 | $8,056 | $36,594 |
| 2023 | $3,201 | $44,650 | $8,056 | $36,594 |
| 2022 | $1,979 | $24,510 | $5,928 | $18,582 |
| 2021 | $2,020 | $24,510 | $5,928 | $18,582 |
| 2020 | $1,939 | $23,298 | $5,928 | $17,370 |
| 2019 | $1,886 | $23,298 | $5,928 | $17,370 |
| 2018 | $1,977 | $22,665 | $4,419 | $18,246 |
| 2017 | $1,977 | $22,665 | $4,419 | $18,246 |
| 2016 | $1,947 | $22,097 | $4,427 | $17,670 |
Source: Public Records
Map
Nearby Homes
- 206 NW Woodbine Ave
- 207 NW Woodbine Ave
- 1005 NW Maple St
- 412 NW Donovan Rd
- 620 NW Village Dr
- 622 NW Village Dr
- 614 NW Fair Ln
- 626 NW Kay Dr
- 626 NW Village Dr
- 104 SW Alderson Place
- 1 NW Walnut St
- 109 SW Walnut St
- 211 NW Orchard Ct
- 213 NW Orchard Ct
- 211-213 NW Orchard Ct
- 219 NW Orchard Ct
- 217 NW Orchard Ct
- 231 NW Orchard Ct
- 27002 NW Olive St
- 27003 NW Olive St
- 505 NW Obrien Rd
- 509 NW Obrien Rd
- 506 NW Obrien Rd
- 503 NW Obrien Rd
- 508 NW Woodbine Ave
- 506 NW Woodbine Ave
- 511 NW Obrien Rd
- 504 NW Woodbine Ave
- 508 NW Obrien Rd
- 502 NW Woodbine Ave
- 500 NW Obrien Rd
- 510 NW Woodbine Ave
- 501 NW Obrien Rd
- 401 NW Village Dr
- 500 NW Woodbine Ave
- 505 NW Woodbine Ave
- 507 NW Woodbine Ave
- 601 NW Obrien Rd
- 509 NW Woodbine Ave
- 403 NW Village Dr
Your Personal Tour Guide
Ask me questions while you tour the home.