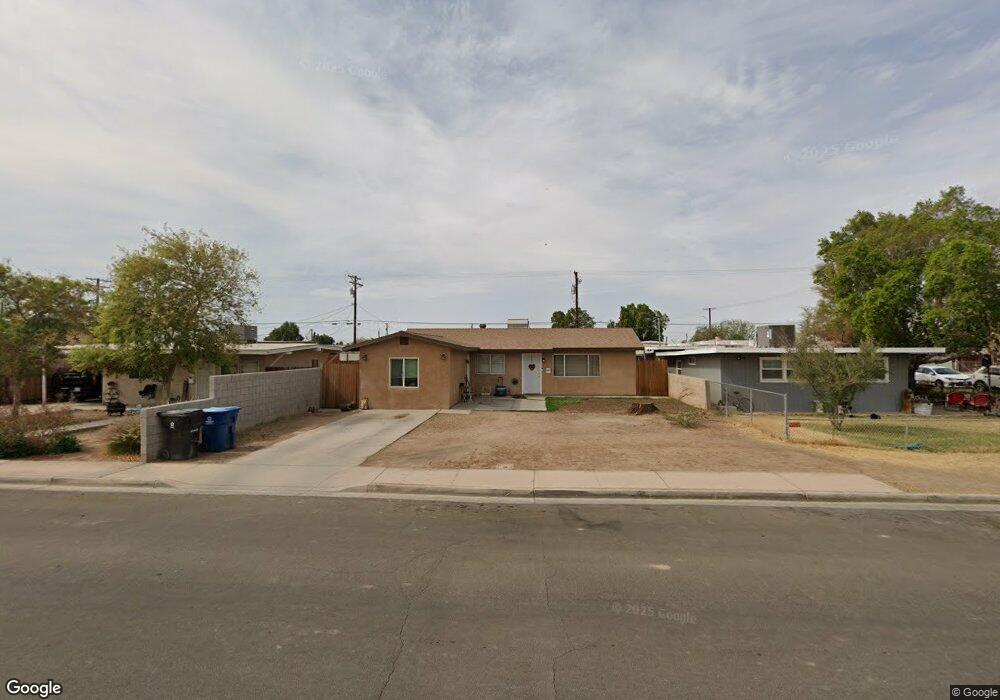
507 S E St Imperial, CA 92251
Estimated Value: $243,000 - $357,000
Studio
--
Bath
1,336
Sq Ft
$230/Sq Ft
Est. Value
About This Home
This home is located at 507 S E St, Imperial, CA 92251 and is currently estimated at $307,620, approximately $230 per square foot. 507 S E St is a home located in Imperial County with nearby schools including Ben Hulse Elementary School, Frank M. Wright Middle School, and Imperial High School.
Ownership History
Date
Name
Owned For
Owner Type
Purchase Details
Closed on
Jul 1, 2019
Sold by
Torrez Alma Angelina Martinez
Bought by
Torrez Daniel A
Current Estimated Value
Home Financials for this Owner
Home Financials are based on the most recent Mortgage that was taken out on this home.
Original Mortgage
$65,644
Outstanding Balance
$57,486
Interest Rate
3.8%
Mortgage Type
Commercial
Estimated Equity
$250,134
Purchase Details
Closed on
Apr 10, 2019
Sold by
Burgos Virginia
Bought by
Torrez Daniel A and Torrez Sandy M
Purchase Details
Closed on
Dec 5, 2018
Sold by
Burgos Virginia
Bought by
Burgos Virginia and Torrez Daniel Antonio
Create a Home Valuation Report for This Property
The Home Valuation Report is an in-depth analysis detailing your home's value as well as a comparison with similar homes in the area
Purchase History
| Date | Buyer | Sale Price | Title Company |
|---|---|---|---|
| Torrez Daniel A | -- | Chicago Title Company | |
| Torrez Daniel A | $75,000 | Chicago Title Company | |
| Burgos Virginia | -- | None Available |
Source: Public Records
Mortgage History
| Date | Status | Borrower | Loan Amount |
|---|---|---|---|
| Open | Torrez Daniel A | $65,644 |
Source: Public Records
Tax History
| Year | Tax Paid | Tax Assessment Tax Assessment Total Assessment is a certain percentage of the fair market value that is determined by local assessors to be the total taxable value of land and additions on the property. | Land | Improvement |
|---|---|---|---|---|
| 2025 | $1,627 | $148,887 | $43,909 | $104,978 |
| 2023 | $1,627 | $143,107 | $42,205 | $100,902 |
| 2022 | $1,593 | $140,302 | $41,378 | $98,924 |
| 2021 | $1,568 | $137,552 | $40,567 | $96,985 |
| 2020 | $1,436 | $125,850 | $40,152 | $85,698 |
| 2019 | $987 | $92,823 | $29,696 | $63,127 |
| 2018 | $973 | $91,004 | $29,114 | $61,890 |
| 2017 | $915 | $89,221 | $28,544 | $60,677 |
| 2016 | $881 | $87,473 | $27,985 | $59,488 |
| 2015 | -- | $86,160 | $27,565 | $58,595 |
| 2014 | -- | $84,474 | $27,026 | $57,448 |
Source: Public Records
Map
Nearby Homes
- 405 S E St
- 717 S E St
- 713 S G St
- 120 W 5th St
- 704 S H St
- 0 N Imperial Ave
- 73 Redwood
- 0 Newside 39a Unit 25618949IC
- 509 N Imperial Ave
- 0 Lee Rd
- 220 W 14th St
- 501 S P St
- 0 S P St
- 623 Bahia St
- 601 E 10th St
- 101 W 14th St Unit 105
- 2575 Clark Rd
- 642 W Brewer Rd Unit 103
- 913 Fieldbrook Ct Unit 1
- 657 Cactus St Unit 2
Your Personal Tour Guide
Ask me questions while you tour the home.