
Seller's Agent in 2026
Jeanne Dominguez
RE/MAX Connections
(760) 983-2828
4 in this area
26 Total Sales
Estimated Value: $1,105,005 - $1,240,000
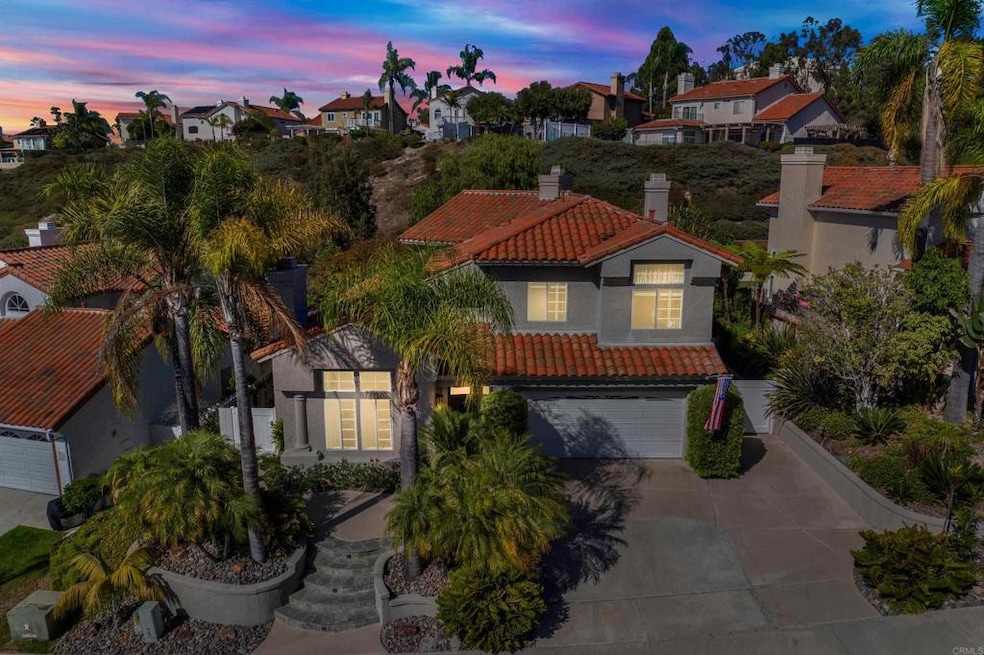
This just may be one of the most beautiful homes in the highly sought after Ocean Terrace neighborhood! Welcome to your new home where tranquility meets timeless elegance! Step into the lush, Zen-inspired backyard and let the soothing sounds of the three-tier koi pond and refreshing ocean breezes melt your stress away! Inside, this meticulously maintained home has been richly and extensively updated throughout. Sunlight fills every room, showcasing luxury vinyl plank flooring, plush high-end carpeting, and stylish fixtures. The gourmet kitchen is a chef’s dream with newer cabinetry, fabulously unique granite countertops, a commercial-style six-burner range, and a striking copper tile backsplash. Entertain with ease in the formal living and dining rooms, or relax in the open family room—complete with one of the home’s three stunning fireplaces! The romantic primary suite features its own fireplace, an ultra modern freestanding soaking tub, dual vanities, an awe inspiring walk-in shower, a spacious walk-in closet, and a sunny private balcony too! Out back, enjoy a true tropical oasis! The secluded yard is fully fenced and filled with mature trees, palms, and vibrant, exquisite landscaping! Multiple patio areas, a shady pergola, and a built-in barbecue with an outdoor fireplace create the perfect setting for gatherings or quiet relaxation. All of this, just minutes from sandy beaches, Calavera Preserve’s scenic hiking trails right outside your door, plus world-class dining, shopping, golf, and more. This stunning home is truly move-in ready...nothing to do but unpack and fall in love!
Last Agent to Sell the Property
RE/MAX Connections Brokerage Email: jeannesells4u@gmail.com License #02078467 Listed on: 09/17/2025
We collect this data history from publicly available records. To have your information removed, we recommend requesting removal directly through your county’s website.
We collect this data history from publicly available records. To have your information removed, we recommend requesting removal directly through your county’s website.
| Date | Buyer | Sale Price | Title Company |
|---|---|---|---|
| $1,156,000 | Fidelity National Title | ||
| -- | None Available | ||
| $192,500 | First American Title | ||
| -- | First American Title | ||
| $219,000 | -- | ||
| $177,000 | -- |
We collect this data history from publicly available records. To have your information removed, we recommend requesting removal directly through your county’s website.
| Date | Status | Borrower | Loan Amount |
|---|---|---|---|
| Previous Owner | $192,146 |
We collect this data history from publicly available records. To have your information removed, we recommend requesting removal directly through your county’s website.
| Date | Event | Price | List to Sale | Price per Sq Ft |
|---|---|---|---|---|
| 02/19/2026 02/19/26 | Sold | $1,156,000 | -1.1% | $604 / Sq Ft |
| 11/05/2025 11/05/25 | Pending | -- | -- | -- |
| 09/17/2025 09/17/25 | For Sale | $1,169,000 | -- | $610 / Sq Ft |
We collect this data history from publicly available records. To have your information removed, we recommend requesting removal directly through your county’s website.
| Year | Tax Paid | Tax Assessment Tax Assessment Total Assessment is a certain percentage of the fair market value that is determined by local assessors to be the total taxable value of land and additions on the property. | Land | Improvement |
|---|---|---|---|---|
| 2025 | $3,526 | $315,604 | $72,819 | $242,785 |
| 2024 | $3,324 | $309,417 | $71,392 | $238,025 |
| 2023 | $3,242 | $303,351 | $69,993 | $233,358 |
| 2022 | $3,232 | $297,404 | $68,621 | $228,783 |
| 2021 | $3,159 | $291,574 | $67,276 | $224,298 |
| 2020 | $3,147 | $288,586 | $66,587 | $221,999 |
| 2019 | $3,099 | $282,929 | $65,282 | $217,647 |
| 2018 | $2,945 | $277,382 | $64,002 | $213,380 |
| 2017 | $2,889 | $271,945 | $62,748 | $209,197 |
| 2016 | $2,818 | $266,614 | $61,518 | $205,096 |
| 2015 | $2,806 | $262,610 | $60,594 | $202,016 |
| 2014 | $2,736 | $257,467 | $59,408 | $198,059 |
Seller's Agent in 2026
Jeanne Dominguez
RE/MAX Connections
(760) 983-2828
4 in this area
26 Total Sales
Buyer's Agent in 2026
Brian Giambrone
RE/MAX
(858) 780-6999
1 in this area
17 Total Sales
Source: California Regional Multiple Listing Service (CRMLS)
MLS Number: NDP2509148
APN: 169-455-42
Disclaimer: Certain information contained herein is derived from information provided by parties other than Homes.com. All information provided is deemed reliable, but is not guaranteed to be accurate and should be independently verified.
![]() The multiple listing data appearing on this website, or contained in reports produced therefrom, is owned and copyrighted by California Regional Multiple Listing Service, Inc. ("CRMLS") and is protected by all applicable copyright laws. Information provided is for viewer's personal, non-commercial use and may not be used for any purpose other than to identify prospective properties the viewer may be interested in purchasing. All listing data, including but not limited to square footage and lot size is believed to be accurate, but the listing Agent, listing Broker and CRMLS and its affiliates do not warrant or guarantee such accuracy. The viewer should independently verify the listed data prior to making any decisions based on such information by personal inspection and/or contacting a real estate professional.
The multiple listing data appearing on this website, or contained in reports produced therefrom, is owned and copyrighted by California Regional Multiple Listing Service, Inc. ("CRMLS") and is protected by all applicable copyright laws. Information provided is for viewer's personal, non-commercial use and may not be used for any purpose other than to identify prospective properties the viewer may be interested in purchasing. All listing data, including but not limited to square footage and lot size is believed to be accurate, but the listing Agent, listing Broker and CRMLS and its affiliates do not warrant or guarantee such accuracy. The viewer should independently verify the listed data prior to making any decisions based on such information by personal inspection and/or contacting a real estate professional.
Based on information from California Regional Multiple Listing Service, Inc. and /or other sources. All data, including all measurements and calculations of area, is obtained from various sources and has not been, and will not be, verified by broker or MLS. All information should be independently reviewed and verified for accuracy. Properties may or may not be listed by the office/agent presenting the information
Ask me questions while you tour the home.