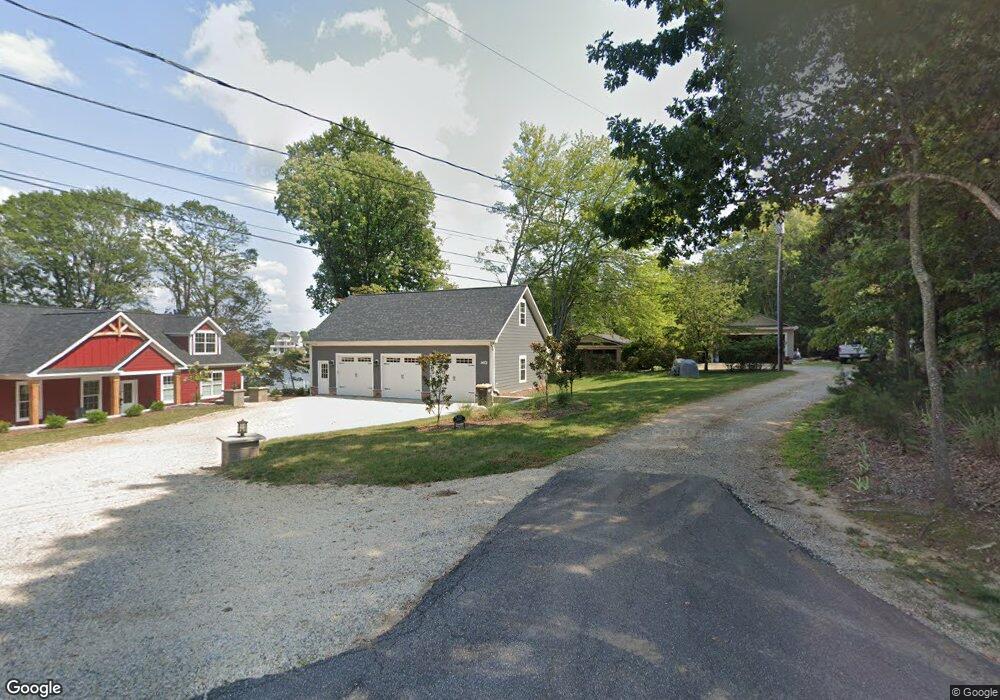
5079 Fox Hollow Dr Unit Lot 14 also Denver, NC 28037
Estimated Value: $328,000 - $966,000
3
Beds
2
Baths
1,545
Sq Ft
$498/Sq Ft
Est. Value
About This Home
This home is located at 5079 Fox Hollow Dr Unit Lot 14 also, Denver, NC 28037 and is currently estimated at $769,631, approximately $498 per square foot. 5079 Fox Hollow Dr Unit Lot 14 also is a home located in Lincoln County with nearby schools including Rock Springs Elementary School, North Lincoln Middle School, and North Lincoln High School.
Ownership History
Date
Name
Owned For
Owner Type
Purchase Details
Closed on
Dec 18, 2024
Sold by
Contessa Lisa Natale and Contessa Thomas
Bought by
Tlc Industries Llc
Current Estimated Value
Purchase Details
Closed on
Aug 7, 2024
Sold by
Contessa Lisa Wale and Contessa Thomas
Bought by
Natale Contessa Lisa
Purchase Details
Closed on
Oct 16, 2020
Sold by
Contessa Lisa Natale and Contessa Thomas
Bought by
Contessa Lisa Natale
Purchase Details
Closed on
Sep 18, 2019
Sold by
Natale Contessa Thomas Rocco and Natale Contessa Lisa
Bought by
Natale Contessa Lisa
Purchase Details
Closed on
Sep 6, 2019
Sold by
Smith Diane M and Smith Keith L
Bought by
Natal Contessa Lisa
Purchase Details
Closed on
Aug 12, 1999
Bought by
D'Avignon Diane M
Create a Home Valuation Report for This Property
The Home Valuation Report is an in-depth analysis detailing your home's value as well as a comparison with similar homes in the area
Home Values in the Area
Average Home Value in this Area
Purchase History
| Date | Buyer | Sale Price | Title Company |
|---|---|---|---|
| Tlc Industries Llc | -- | None Listed On Document | |
| Natale Contessa Lisa | -- | None Listed On Document | |
| Contessa Lisa Natale | -- | None Available | |
| Natale Contessa Lisa | -- | None Available | |
| Natal Contessa Lisa | $510,000 | None Available | |
| D'Avignon Diane M | $210,000 | -- |
Source: Public Records
Tax History Compared to Growth
Tax History
| Year | Tax Paid | Tax Assessment Tax Assessment Total Assessment is a certain percentage of the fair market value that is determined by local assessors to be the total taxable value of land and additions on the property. | Land | Improvement |
|---|---|---|---|---|
| 2025 | $5,101 | $820,068 | $662,680 | $157,388 |
| 2024 | $3,776 | $606,342 | $448,954 | $157,388 |
| 2023 | $3,771 | $606,342 | $448,954 | $157,388 |
| 2022 | $3,468 | $452,472 | $358,915 | $93,557 |
| 2021 | $3,436 | $452,472 | $358,915 | $93,557 |
| 2020 | $3,231 | $452,472 | $358,915 | $93,557 |
| 2019 | $3,231 | $452,472 | $358,915 | $93,557 |
| 2018 | $3,341 | $443,245 | $350,146 | $93,099 |
| 2017 | $3,218 | $443,245 | $350,146 | $93,099 |
| 2016 | $3,207 | $443,245 | $350,146 | $93,099 |
| 2015 | $3,255 | $443,245 | $350,146 | $93,099 |
| 2014 | $3,489 | $481,221 | $399,860 | $81,361 |
Source: Public Records
Map
Nearby Homes
- 5086 Windward Point Ln
- 4907 White Oak Ln
- 7861 Live Oaks Dr
- 5056 Bridge Way
- 4853 Austin Shores Dr
- 4548 Stonesthrow Dr
- 00 Hawkes Bay Ct Unit 121
- 4628 Sierra View Dr
- 4550 Osprey Run Ct
- 102 Stone Point Ct
- 7674 Bermuda Hills Ln
- 472 Barber Loop
- 150 Fawn Ln
- 4511 Morning Dove Ct
- 4424 Augusta Ridge Ct
- 00 Summit Ridge Ln
- 3988 Channel Point Ln
- 388 Stonemarker Rd
- 4609 Firethorn Ct
- 3946 Lake Spring Cove Ct
- 5079 Fox Hollow Dr
- 5073 Fox Hollow Dr
- 7731 Cambridge Way
- 5067 Fox Hollow Dr
- 7737 Cambridge Way
- 5061 Fox Hollow Dr
- 5045 Fox Hollow Dr
- 5020 Fox Hollow Dr
- 8069 Mcconnell Rd
- 8061 Mcconnell Rd
- 8097 Mcconnell Rd
- 8135 Mcconnell Rd
- 5027 Fox Hollow Dr
- 8087 Mcconnell Rd
- 8047 Mcconnell Rd
- 8047 Mcconnell Rd Unit 5
- 4998 Fox Hollow Dr
- 80 Harbour Ridge Ct
- 8029 Mcconnell Rd
- 79 Harbour Ridge Ct