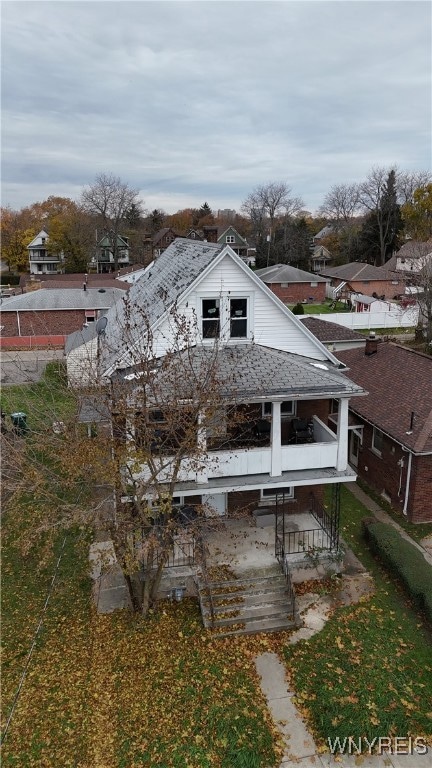
508 27th St Niagara Falls, NY 14301
South End NeighborhoodHighlights
- Porch
- Open Patio
- Baseboard Heating
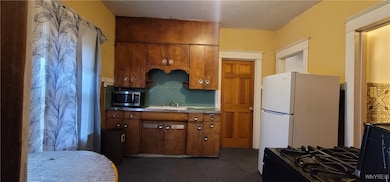
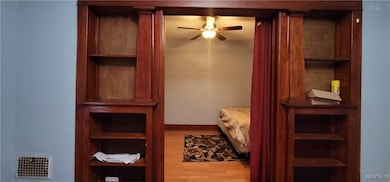
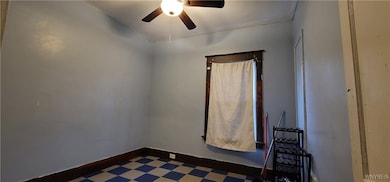
About This Home
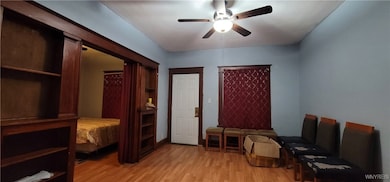
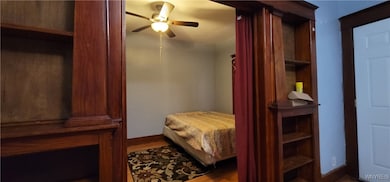
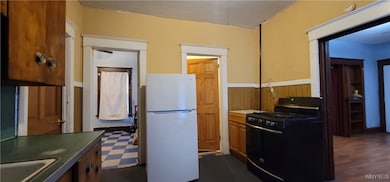
Ground floor, two-bedroom apartment is available for rent, with a front porch and a backyard to enjoy the weather in summer.
Listing Agent
Listing by Red Hawk Real Estate License #10491212375 Listed on: 11/27/2025
Property Details
Home Type
- Apartment
Year Built
- Built in 1935
Lot Details
- 5,080 Sq Ft Lot
- Lot Dimensions are 40x127
Parking
- Driveway
Interior Spaces
- 2,024 Sq Ft Home
- Basement Fills Entire Space Under The House
Bedrooms and Bathrooms
- 2 Bedrooms
- 1 Full Bathroom
Outdoor Features
- Open Patio
- Porch
Utilities
- Baseboard Heating
Listing and Financial Details
- Property Available on 12/1/25
- Rent includes sewer, water
- 12 Month Lease Term
- Tax Lot 24
- Assessor Parcel Number 291100-159-026-0003-024-000
Community Details
Overview
- Stedman Farm Subdivision
Pet Policy
- No Pets Allowed
Map
Property History
| Date | Event | Price | List to Sale | Price per Sq Ft |
|---|---|---|---|---|
| 11/27/2025 11/27/25 | For Rent | $1,000 | -- | -- |
Source: Western New York Real Estate Information Services (WNYREIS)
MLS Number: B1652790
APN: 291100-159-026-0003-024-000
Disclaimer: Certain information contained herein is derived from information provided by parties other than Homes.com. All information provided is deemed reliable, but is not guaranteed to be accurate and should be independently verified.
![]() The data relating to real estate on this web site comes in part from the Internet Data Exchange (IDX) Program of the CNYIS, UNYREIS and WNYREIS. Real estate listings held by firms other than Homes.com, LLC are marked with the IDX logo and include the Listing Broker’s Firm Name.
The data relating to real estate on this web site comes in part from the Internet Data Exchange (IDX) Program of the CNYIS, UNYREIS and WNYREIS. Real estate listings held by firms other than Homes.com, LLC are marked with the IDX logo and include the Listing Broker’s Firm Name.
Disclaimer: All information deemed reliable but not guaranteed and should be independently verified. All properties
are subject to prior sale, change or withdrawal. Neither the listing broker(s) nor Homes.com, LLC shall be responsible for any typographical errors, misinformation, misprints, and shall be held totally harmless.
© 2026 CNYIS, UNYREIS, WNYREIS. All rights reserved.
- 609 24th St
- 609 22nd St
- 2460 Grand Ave Unit 2
- 3553 Sherwood Ave
- 2734 Ave
- 769 19th St Unit lower
- 1625 Walnut Ave Unit Upper 1 bedroom
- 1023 15th St Unit 1
- 901 Cedar Ave
- 704 8th St
- 1536 Niagara Ave
- 427 5th St
- 427 5th St
- 1128 South Ave
- 644 Park Place Unit 1
- 1312 Ontario Ave Unit Upper
- 1312 Ontario Ave Unit Lower
- 531 3rd St
- 530 Main St Unit 306
- 530 Main St Unit 3

Ask me questions while you tour the home.