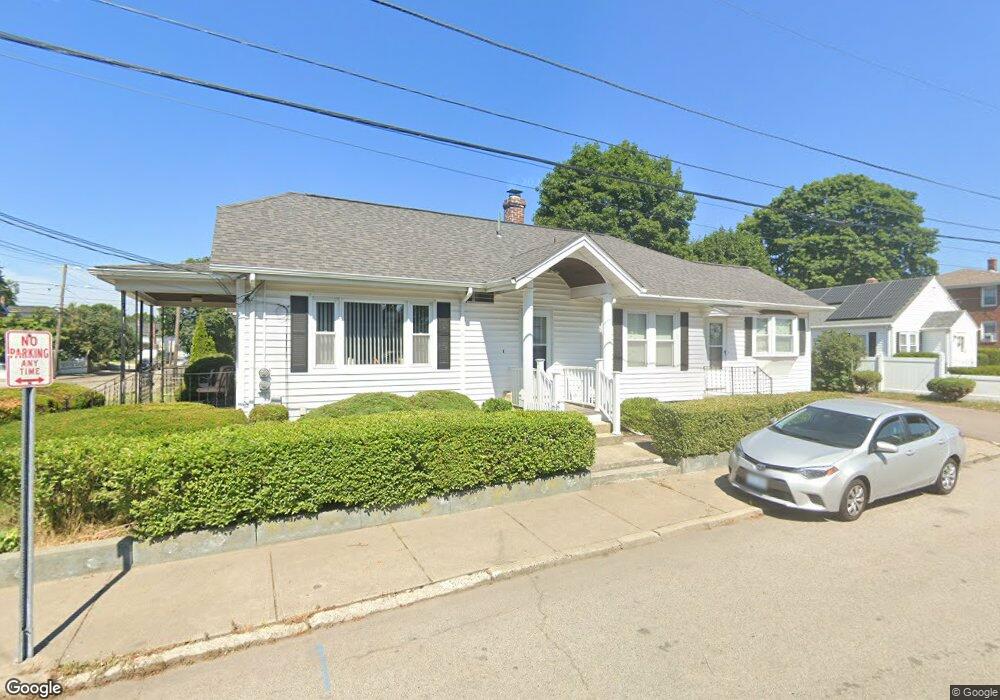
508 Benefit St Pawtucket, RI 02861
Darlington NeighborhoodEstimated Value: $363,512 - $532,000
3
Beds
2
Baths
1,274
Sq Ft
$358/Sq Ft
Est. Value
About This Home
This home is located at 508 Benefit St, Pawtucket, RI 02861 and is currently estimated at $456,128, approximately $358 per square foot. 508 Benefit St is a home located in Providence County with nearby schools including St Cecilia School and Dayspring Christian Academy.
Ownership History
Date
Name
Owned For
Owner Type
Purchase Details
Closed on
Jan 25, 2021
Sold by
Levesque Robert G
Bought by
Lisi Salvatore G and Lisi Kimberly A
Current Estimated Value
Purchase Details
Closed on
Jan 14, 2020
Sold by
Levesque Robert
Bought by
Robert Levesque Irt
Purchase Details
Closed on
Jun 30, 2011
Sold by
Codagnone Guido A
Bought by
Levesque Evelyn B and Levesque Robert G
Create a Home Valuation Report for This Property
The Home Valuation Report is an in-depth analysis detailing your home's value as well as a comparison with similar homes in the area
Home Values in the Area
Average Home Value in this Area
Purchase History
| Date | Buyer | Sale Price | Title Company |
|---|---|---|---|
| Lisi Salvatore G | -- | None Available | |
| Lisi Salvatore G | $170,000 | None Available | |
| Robert Levesque Irt | -- | None Available | |
| Levesque Robert G | -- | None Available | |
| Levesque Evelyn B | -- | -- |
Source: Public Records
Tax History
| Year | Tax Paid | Tax Assessment Tax Assessment Total Assessment is a certain percentage of the fair market value that is determined by local assessors to be the total taxable value of land and additions on the property. | Land | Improvement |
|---|---|---|---|---|
| 2025 | $4,209 | $320,100 | $107,800 | $212,300 |
| 2024 | $3,950 | $320,100 | $107,800 | $212,300 |
| 2023 | $3,898 | $230,100 | $79,900 | $150,200 |
| 2022 | $3,815 | $230,100 | $79,900 | $150,200 |
| 2021 | $3,815 | $230,100 | $79,900 | $150,200 |
| 2020 | $3,587 | $171,700 | $72,000 | $99,700 |
| 2019 | $3,587 | $171,700 | $72,000 | $99,700 |
| 2018 | $3,456 | $171,700 | $72,000 | $99,700 |
| 2017 | $3,013 | $132,600 | $55,500 | $77,100 |
| 2016 | $2,903 | $132,600 | $55,500 | $77,100 |
| 2015 | $2,903 | $132,600 | $55,500 | $77,100 |
| 2014 | $2,779 | $120,500 | $50,000 | $70,500 |
Source: Public Records
Map
Nearby Homes
Your Personal Tour Guide
Ask me questions while you tour the home.