Estimated Value: $133,000 - $163,874
2
Beds
1
Bath
1,014
Sq Ft
$149/Sq Ft
Est. Value
About This Home
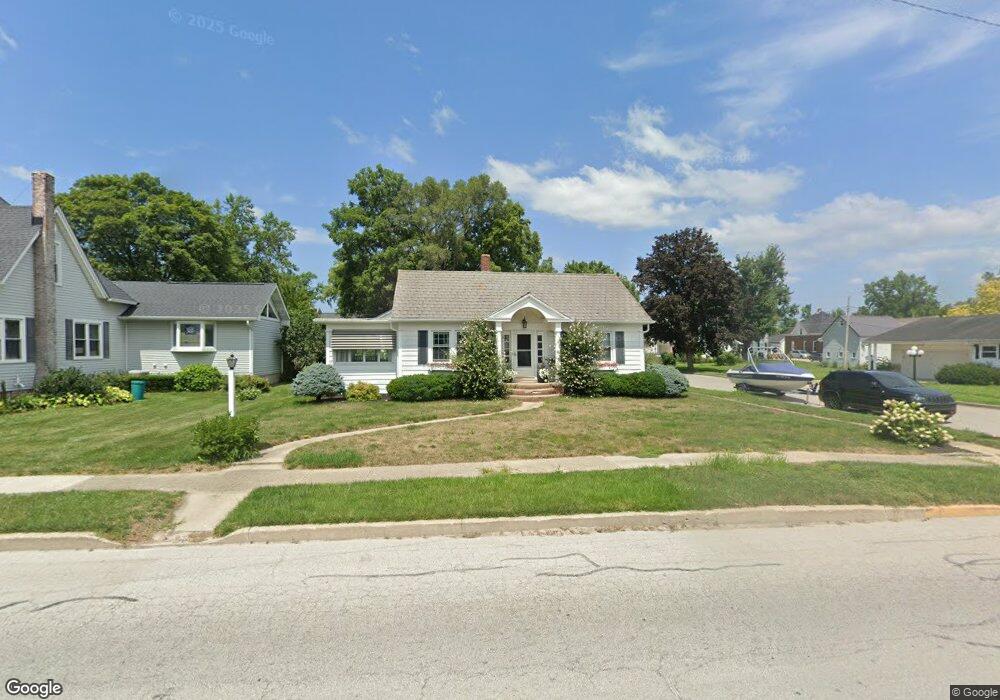
This home is located at 508 E Columbia St, Flora, IN 46929 and is currently estimated at $150,719, approximately $148 per square foot. 508 E Columbia St is a home located in Carroll County with nearby schools including Carroll Elementary School and Carroll Senior High School.
Ownership History
Date
Name
Owned For
Owner Type
Purchase Details
Closed on
Dec 30, 2024
Sold by
Spesard Lance L and Spesard Debra K
Bought by
Spesard Adam and Spesard Emily
Current Estimated Value
Home Financials for this Owner
Home Financials are based on the most recent Mortgage that was taken out on this home.
Original Mortgage
$72,500
Outstanding Balance
$71,741
Interest Rate
6.84%
Mortgage Type
New Conventional
Estimated Equity
$78,978
Purchase Details
Closed on
Jan 4, 2017
Sold by
Trapp Mary J
Bought by
Spesard Lance L and Spesard Debra K
Home Financials for this Owner
Home Financials are based on the most recent Mortgage that was taken out on this home.
Original Mortgage
$58,400
Interest Rate
4.03%
Purchase Details
Closed on
Jul 28, 2011
Sold by
Beckner Regina L
Bought by
Mary J Trapp Living Trust
Purchase Details
Closed on
Aug 25, 2009
Sold by
Humes Fred
Bought by
Humes Fred
Create a Home Valuation Report for This Property
The Home Valuation Report is an in-depth analysis detailing your home's value as well as a comparison with similar homes in the area
Purchase History
| Date | Buyer | Sale Price | Title Company |
|---|---|---|---|
| Spesard Adam | -- | Columbia Title | |
| Spesard Adam | -- | Columbia Title | |
| Spesard Lance L | -- | None Available | |
| Mary J Trapp Living Trust | -- | None Available | |
| Humes Fred | -- | None Available |
Source: Public Records
Mortgage History
| Date | Status | Borrower | Loan Amount |
|---|---|---|---|
| Open | Spesard Adam | $72,500 | |
| Closed | Spesard Adam | $72,500 | |
| Previous Owner | Spesard Lance L | $58,400 |
Source: Public Records
Tax History
| Year | Tax Paid | Tax Assessment Tax Assessment Total Assessment is a certain percentage of the fair market value that is determined by local assessors to be the total taxable value of land and additions on the property. | Land | Improvement |
|---|---|---|---|---|
| 2025 | $752 | $131,900 | $15,400 | $116,500 |
| 2024 | $752 | $111,500 | $15,400 | $96,100 |
| 2023 | $592 | $98,700 | $11,100 | $87,600 |
| 2022 | $592 | $87,700 | $11,100 | $76,600 |
| 2021 | $482 | $74,900 | $11,100 | $63,800 |
| 2020 | $407 | $69,300 | $11,100 | $58,200 |
| 2019 | $417 | $65,200 | $12,400 | $52,800 |
| 2018 | $399 | $64,000 | $12,400 | $51,600 |
| 2017 | $385 | $63,200 | $12,400 | $50,800 |
| 2016 | $1,250 | $60,800 | $12,400 | $48,400 |
| 2014 | $1,352 | $67,600 | $10,900 | $56,700 |
Source: Public Records
Map
Nearby Homes
- 504 E Columbia St
- 604 E Columbia St
- 515 E Main St
- 511 E Main St
- 608 E Columbia St
- 511 E Columbia St
- 507 E Columbia St
- 507 E Main St
- 603 E Main St
- 515 E Columbia St
- 503 E Columbia St
- 607 E Main St
- 612 E Columbia St
- 503 E Main St
- 605 E Columbia St
- 611 E Main St
- 419 E Columbia St
- 616 E Columbia St
- 609 E Columbia St
- 512 E Jackson St
Your Personal Tour Guide
Ask me questions while you tour the home.