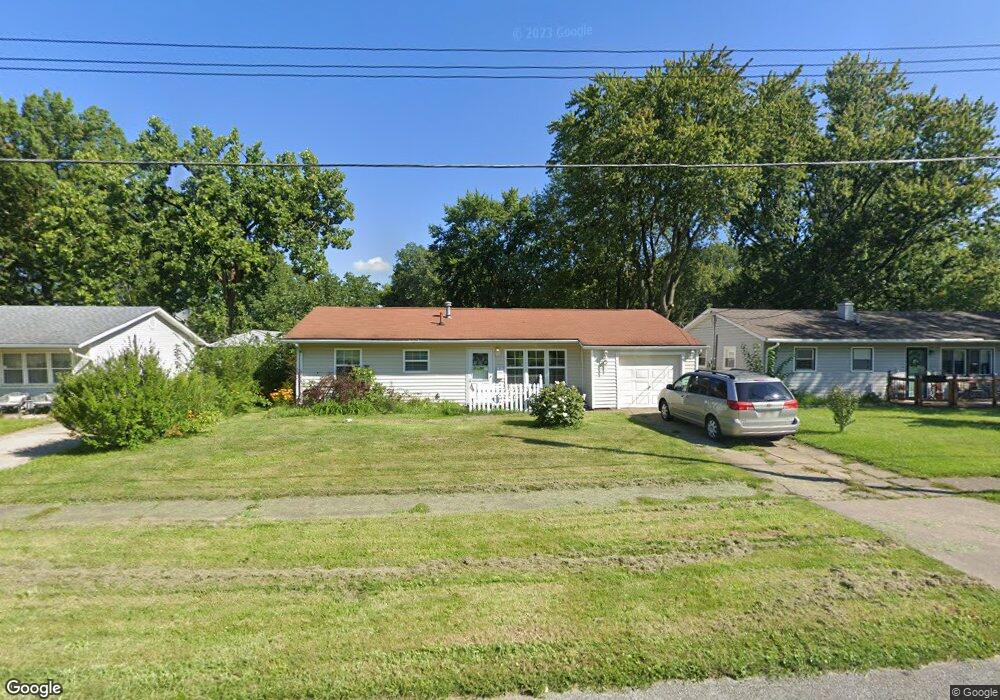
508 Stanford Ave Elyria, OH 44035
Estimated Value: $149,000 - $184,000
3
Beds
1
Bath
1,304
Sq Ft
$125/Sq Ft
Est. Value
About This Home
This home is located at 508 Stanford Ave, Elyria, OH 44035 and is currently estimated at $162,376, approximately $124 per square foot. 508 Stanford Ave is a home located in Lorain County with nearby schools including Eastern Heights Middle School, Elyria High School, and Constellation Schools: Elyria Community Elementary.
Ownership History
Date
Name
Owned For
Owner Type
Purchase Details
Closed on
Oct 29, 2018
Sold by
Fraam Lewis G and L J F Trust
Bought by
Fraam Lewis G and Lewis J Fraam Trust
Current Estimated Value
Purchase Details
Closed on
Jan 12, 2016
Sold by
Cuson Richard Todd and Remy Lois E
Bought by
Carver Joyce Elaine
Home Financials for this Owner
Home Financials are based on the most recent Mortgage that was taken out on this home.
Original Mortgage
$25,000
Outstanding Balance
$19,863
Interest Rate
3.93%
Mortgage Type
Purchase Money Mortgage
Estimated Equity
$142,513
Purchase Details
Closed on
Dec 19, 2009
Sold by
Cuson Richard T and Cuson Rebecca L
Bought by
Remy Lois E
Purchase Details
Closed on
Feb 13, 2009
Sold by
Fannie Mae
Bought by
Cuson Richard T and Cuson Rebecca L
Purchase Details
Closed on
Dec 30, 2008
Sold by
Gore Russell
Bought by
Federal National Mortgage Association
Create a Home Valuation Report for This Property
The Home Valuation Report is an in-depth analysis detailing your home's value as well as a comparison with similar homes in the area
Home Values in the Area
Average Home Value in this Area
Purchase History
| Date | Buyer | Sale Price | Title Company |
|---|---|---|---|
| Fraam Lewis G | -- | None Available | |
| Carver Joyce Elaine | $25,000 | None Available | |
| Remy Lois E | -- | Attorney | |
| Cuson Richard T | $39,000 | None Available | |
| Federal National Mortgage Association | $46,000 | None Available |
Source: Public Records
Mortgage History
| Date | Status | Borrower | Loan Amount |
|---|---|---|---|
| Open | Carver Joyce Elaine | $25,000 |
Source: Public Records
Tax History
| Year | Tax Paid | Tax Assessment Tax Assessment Total Assessment is a certain percentage of the fair market value that is determined by local assessors to be the total taxable value of land and additions on the property. | Land | Improvement |
|---|---|---|---|---|
| 2024 | $2,059 | $42,466 | $10,434 | $32,032 |
| 2023 | $2,021 | $36,197 | $8,432 | $27,766 |
| 2022 | $2,014 | $36,197 | $8,432 | $27,766 |
| 2021 | $2,019 | $36,197 | $8,432 | $27,766 |
| 2020 | $1,776 | $28,330 | $6,600 | $21,730 |
| 2019 | $1,765 | $28,330 | $6,600 | $21,730 |
| 2018 | $1,768 | $28,330 | $6,600 | $21,730 |
| 2017 | $1,666 | $25,580 | $6,690 | $18,890 |
| 2016 | $1,645 | $25,580 | $6,690 | $18,890 |
| 2015 | $1,543 | $25,580 | $6,690 | $18,890 |
| 2014 | $1,033 | $26,550 | $6,940 | $19,610 |
| 2013 | $1,023 | $26,550 | $6,940 | $19,610 |
Source: Public Records
Map
Nearby Homes
- 549 Delaware Ave
- 1210 Prospect St
- 914 Garford Ave
- 523 Purdue Ave
- 817 Boston Ave
- 746 Delaware Ave
- 800 Boston Ave
- 708 Park Ave
- 832 S Logan St
- 340 Boston Ave
- 453 Kenyon Ave
- 337 University Ave
- 355 Kenyon Ave
- 347 Kenyon Ave
- 150 Denison Ave
- 139 Cornell Ave
- 247 Georgia Ave
- 119 Cornell Ave
- 209 Clark St
- 805 Clark St
- 504 Stanford Ave
- 514 Stanford Ave
- 518 Stanford Ave
- 500 Stanford Ave
- 509 Denison Ave
- 515 Denison Ave
- 505 Denison Ave
- 519 Denison Ave
- 501 Denison Ave
- 522 Stanford Ave
- 1004 Prospect St
- 523 Denison Ave
- 528 Stanford Ave
- 523 Stanford Ave
- 529 Denison Ave
- 532 Stanford Ave
- 508 Denison Ave
- 504 Denison Ave
- 514 Denison Ave
- 533 Denison Ave
Your Personal Tour Guide
Ask me questions while you tour the home.