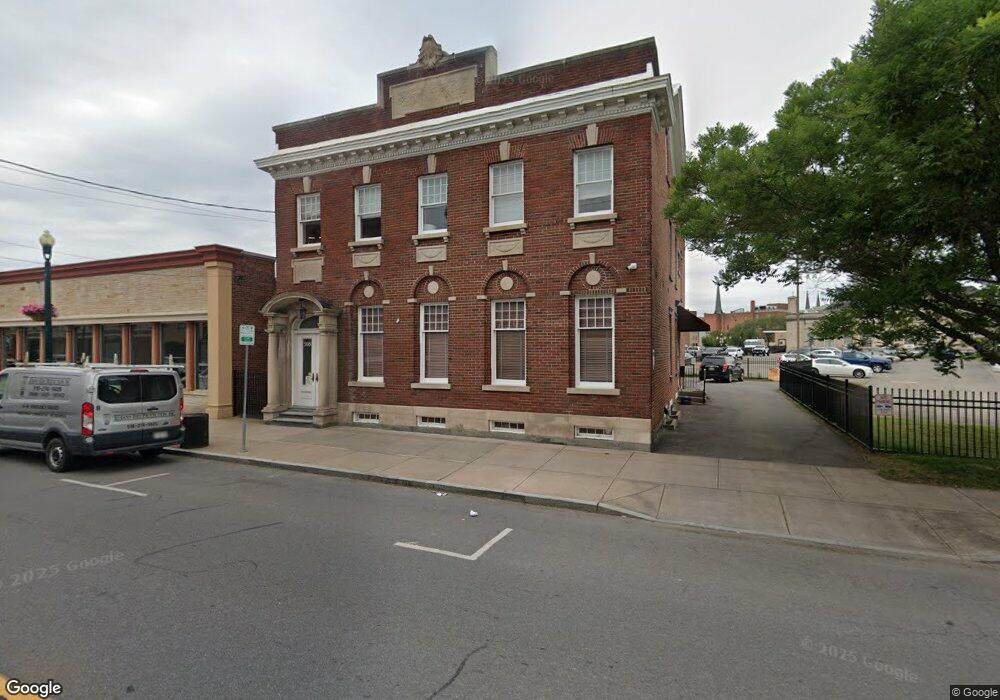
508 Union St Schenectady, NY 12305
Downtown Schenectady NeighborhoodEstimated Value: $710,143
1
Bed
1
Bath
900
Sq Ft
$789/Sq Ft
Est. Value
About This Home
This home is located at 508 Union St, Schenectady, NY 12305 and is currently estimated at $710,143, approximately $789 per square foot. 508 Union St is a home located in Schenectady County with nearby schools including Yates Elementary School, Oneida Middle School, and Schenectady High School.
Ownership History
Date
Name
Owned For
Owner Type
Purchase Details
Closed on
Feb 7, 2025
Sold by
508 Union Steet Llc
Bought by
Miwok Properties Llc
Current Estimated Value
Home Financials for this Owner
Home Financials are based on the most recent Mortgage that was taken out on this home.
Original Mortgage
$475,000
Interest Rate
6.87%
Mortgage Type
New Conventional
Purchase Details
Closed on
May 26, 2016
Sold by
The City Of Schenectady
Bought by
508 Union Street Llc
Purchase Details
Closed on
Mar 15, 2016
Sold by
The City Of Schenectady
Bought by
The Schenectady Urban Renewal Agency
Purchase Details
Closed on
Nov 9, 2015
Sold by
City Of Schenectady
Bought by
City Of Schenectady
Create a Home Valuation Report for This Property
The Home Valuation Report is an in-depth analysis detailing your home's value as well as a comparison with similar homes in the area
Home Values in the Area
Average Home Value in this Area
Purchase History
| Date | Buyer | Sale Price | Title Company |
|---|---|---|---|
| Miwok Properties Llc | $670,000 | None Listed On Document | |
| 508 Union Street Llc | $50,000 | None Available | |
| The City Of Schenectady | $500 | None Available | |
| The Schenectady Urban Renewal Agency | $500 | None Available | |
| City Of Schenectady | -- | Rachael Ward | |
| The City Of Schenectady | -- | None Available |
Source: Public Records
Mortgage History
| Date | Status | Borrower | Loan Amount |
|---|---|---|---|
| Previous Owner | Miwok Properties Llc | $475,000 |
Source: Public Records
Tax History
| Year | Tax Paid | Tax Assessment Tax Assessment Total Assessment is a certain percentage of the fair market value that is determined by local assessors to be the total taxable value of land and additions on the property. | Land | Improvement |
|---|---|---|---|---|
| 2024 | $5,258 | $234,700 | $19,100 | $215,600 |
| 2023 | $42 | $234,700 | $19,100 | $215,600 |
| 2022 | $3,663 | $234,700 | $19,100 | $215,600 |
| 2021 | $3,629 | $234,700 | $19,100 | $215,600 |
| 2020 | $3,947 | $234,700 | $19,100 | $215,600 |
| 2019 | $2,271 | $234,700 | $19,100 | $215,600 |
| 2018 | $4,392 | $100,000 | $19,100 | $80,900 |
| 2017 | $4,832 | $47,900 | $19,100 | $28,800 |
| 2016 | $4,912 | $233,100 | $19,100 | $214,000 |
| 2015 | -- | $233,100 | $19,100 | $214,000 |
| 2014 | -- | $233,100 | $19,100 | $214,000 |
Source: Public Records
Map
Nearby Homes
- 701 Union St
- 9 N College St
- 246 Union St
- 714 Union St
- 1143 Barrett St
- 117 N College St
- 322 State St
- 229 Green St
- 206 Front St
- 210 Union St
- 208 Front St
- 113 S Ferry St
- 137 Front St Unit 311
- 137 Front Sreet Unit 311
- 21 N Ferry St
- 11 River St
- 13 Ingersoll Ave
- 18 Ingersoll Ave
- 11 Landon Terrace
- 312 Georgetta Dix Plaza
- 509A Union St
- 509 Union St
- 509 Union St
- 501 Union St
- 507 Union St
- 505 Union St
- 511 Union St Unit 4
- 511 Union St Unit 7
- 511 Union St
- 511 Union St Unit 1
- 511 Union St
- 521 Union St
- 6 N Jay St
- 12 Jay St
- 7 N Jay St
- 525 Union St Unit 401
- 525 Union St Unit 201
- 525 Union St Unit 101
- 525Union St 402
- 515 Union St
Your Personal Tour Guide
Ask me questions while you tour the home.