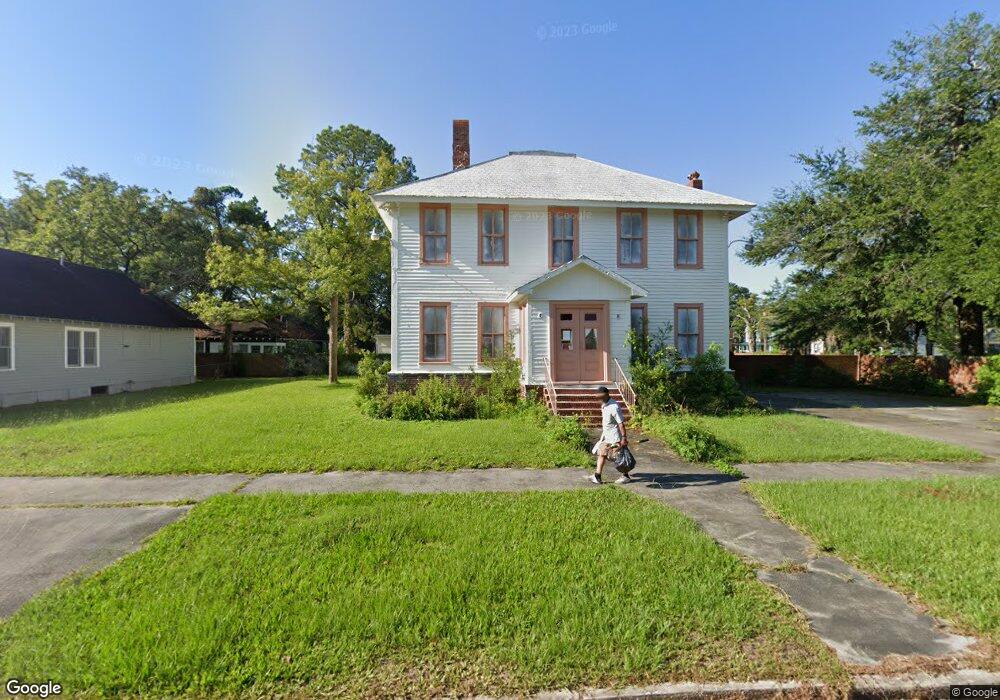
508 Williams St Waycross, GA 31501
Estimated Value: $159,000 - $293,054
9
Beds
6
Baths
6,630
Sq Ft
$34/Sq Ft
Est. Value
About This Home
This home is located at 508 Williams St, Waycross, GA 31501 and is currently estimated at $225,264, approximately $33 per square foot. 508 Williams St is a home located in Ware County with nearby schools including Williams Heights Elementary School, Waycross Middle School, and Ware County High School.
Ownership History
Date
Name
Owned For
Owner Type
Purchase Details
Closed on
Feb 24, 2015
Sold by
First Southern Bank
Bought by
Riechert Theresia
Current Estimated Value
Purchase Details
Closed on
Sep 8, 2010
Sold by
The Patterson Bank
Bought by
The Patterson Bank
Purchase Details
Closed on
May 27, 2008
Sold by
Sarup Melissa M
Bought by
Sarup Uday
Purchase Details
Closed on
Jun 5, 2007
Sold by
Floyd Gary D
Bought by
The Bank Of New York Trust Co
Purchase Details
Closed on
Feb 25, 2005
Sold by
Boatright Idelle Elizabeth
Bought by
Floyd Gary D and Floyd Sherri L
Home Financials for this Owner
Home Financials are based on the most recent Mortgage that was taken out on this home.
Original Mortgage
$81,000
Interest Rate
5.6%
Mortgage Type
Commercial
Create a Home Valuation Report for This Property
The Home Valuation Report is an in-depth analysis detailing your home's value as well as a comparison with similar homes in the area
Purchase History
| Date | Buyer | Sale Price | Title Company |
|---|---|---|---|
| Riechert Theresia | $30,000 | -- | |
| The Patterson Bank | -- | -- | |
| Sarup Uday | -- | -- | |
| Sarup Melissa M | $60,000 | -- | |
| The Bank Of New York Trust Co | $81,427 | -- | |
| Floyd Gary D | $90,000 | -- |
Source: Public Records
Mortgage History
| Date | Status | Borrower | Loan Amount |
|---|---|---|---|
| Previous Owner | Floyd Gary D | $81,000 |
Source: Public Records
Tax History
| Year | Tax Paid | Tax Assessment Tax Assessment Total Assessment is a certain percentage of the fair market value that is determined by local assessors to be the total taxable value of land and additions on the property. | Land | Improvement |
|---|---|---|---|---|
| 2025 | $4,352 | $128,812 | $3,850 | $124,962 |
| 2024 | $4,352 | $104,220 | $3,850 | $100,370 |
| 2023 | $3,594 | $48,841 | $1,876 | $46,965 |
| 2022 | $1,946 | $48,841 | $1,876 | $46,965 |
| 2021 | $1,771 | $40,960 | $1,876 | $39,084 |
| 2020 | $1,755 | $40,262 | $1,876 | $38,386 |
| 2019 | $1,703 | $38,517 | $1,876 | $36,641 |
| 2018 | $1,641 | $36,772 | $1,876 | $34,896 |
| 2017 | $1,603 | $36,772 | $1,876 | $34,896 |
| 2016 | $1,603 | $36,772 | $1,876 | $34,896 |
| 2015 | $1,615 | $36,772 | $1,876 | $34,896 |
| 2014 | $1,613 | $36,772 | $1,876 | $34,896 |
| 2013 | -- | $32,800 | $1,876 | $30,924 |
Source: Public Records
Map
Nearby Homes
- 604 Hicks St
- 605 Williams St
- 0 Quiesqueya Cir Unit 7713854
- 7059 Thornbird Rd
- 705 Gilmore St
- 801 Lee Ave
- 615 Morton Ave
- 212 Butler St
- 506 McDonald St
- 905 Mary St
- 907 Mary St
- 1302 Riverside Dr
- 915 Carswell Ave
- 807 College St
- 1003 Scruggs St
- 1004 Hill St
- 1003 Carswell Ave
- 601 N Nicholls St
- 808 Satilla Blvd
- 1006 Roosevelt St
Your Personal Tour Guide
Ask me questions while you tour the home.