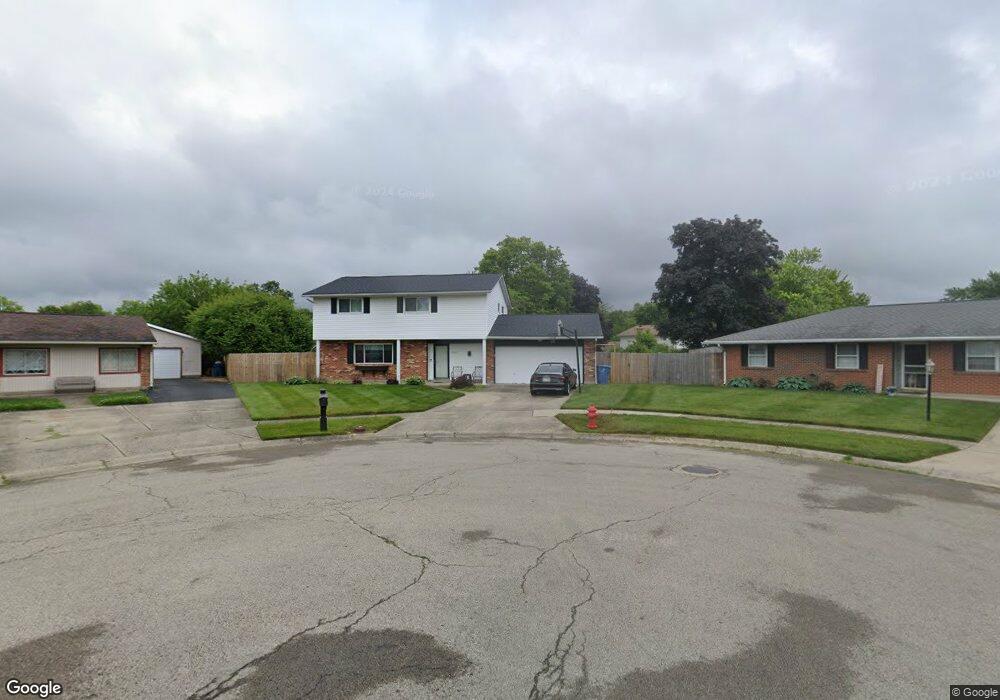
5081 Ashview Ct Dayton, OH 45424
Estimated Value: $253,000 - $273,667
3
Beds
3
Baths
1,915
Sq Ft
$136/Sq Ft
Est. Value
About This Home
This home is located at 5081 Ashview Ct, Dayton, OH 45424 and is currently estimated at $260,417, approximately $135 per square foot. 5081 Ashview Ct is a home located in Montgomery County with nearby schools including Wayne High School and Huber Heights Christian Academy.
Ownership History
Date
Name
Owned For
Owner Type
Purchase Details
Closed on
Aug 26, 2003
Sold by
Tennon Kevin C and Tennon Theata Y
Bought by
Butcher Regina
Current Estimated Value
Home Financials for this Owner
Home Financials are based on the most recent Mortgage that was taken out on this home.
Original Mortgage
$107,000
Outstanding Balance
$61,053
Interest Rate
9.73%
Mortgage Type
Purchase Money Mortgage
Estimated Equity
$199,364
Purchase Details
Closed on
Apr 20, 2000
Sold by
Tennon Kevin C and Lambert Tennon Theata
Bought by
Butcher Regina
Home Financials for this Owner
Home Financials are based on the most recent Mortgage that was taken out on this home.
Original Mortgage
$106,650
Interest Rate
9.87%
Mortgage Type
Seller Take Back
Purchase Details
Closed on
Apr 25, 1997
Sold by
Pasco Ronald G and Pasco Kathy L
Bought by
Robbins Richard D and Robbins Tricia A
Create a Home Valuation Report for This Property
The Home Valuation Report is an in-depth analysis detailing your home's value as well as a comparison with similar homes in the area
Home Values in the Area
Average Home Value in this Area
Purchase History
| Date | Buyer | Sale Price | Title Company |
|---|---|---|---|
| Butcher Regina | $118,500 | -- | |
| Butcher Regina | $118,500 | -- | |
| Robbins Richard D | $112,500 | -- |
Source: Public Records
Mortgage History
| Date | Status | Borrower | Loan Amount |
|---|---|---|---|
| Open | Butcher Regina | $107,000 | |
| Previous Owner | Butcher Regina | $106,650 |
Source: Public Records
Tax History Compared to Growth
Tax History
| Year | Tax Paid | Tax Assessment Tax Assessment Total Assessment is a certain percentage of the fair market value that is determined by local assessors to be the total taxable value of land and additions on the property. | Land | Improvement |
|---|---|---|---|---|
| 2024 | $3,757 | $73,100 | $12,340 | $60,760 |
| 2023 | $3,757 | $73,100 | $12,340 | $60,760 |
| 2022 | $3,383 | $51,870 | $8,750 | $43,120 |
| 2021 | $3,524 | $51,870 | $8,750 | $43,120 |
| 2020 | $3,527 | $51,870 | $8,750 | $43,120 |
| 2019 | $3,088 | $39,910 | $8,750 | $31,160 |
| 2018 | $3,098 | $39,910 | $8,750 | $31,160 |
| 2017 | $3,078 | $39,910 | $8,750 | $31,160 |
| 2016 | $2,896 | $37,770 | $8,750 | $29,020 |
| 2015 | $2,859 | $37,770 | $8,750 | $29,020 |
| 2014 | $2,859 | $37,770 | $8,750 | $29,020 |
| 2012 | -- | $41,700 | $9,630 | $32,070 |
Source: Public Records
Map
Nearby Homes
- 5580 Clagston Ct
- 5582 Camerford Dr
- 4931 Longford Rd
- 5873 Troy Villa Blvd Unit 20174
- 7077 Sandalview Dr
- 5631 Longford Rd
- 4834 Lodgeview Dr
- 6724 Willow Creek Dr
- 6851 Locustview Dr
- 6686 Oakwood Ln
- 5637 Troy Villa Blvd Unit 20088
- 6805 Willow Creek Dr
- 6828 Willow Creek Dr
- 5907 Beech Ct
- 6514 Wrenview Ct
- 6936 Willow Tree Ln
- 7500 Mount Ranier Unit 12077
- 4731 Deerwood Ct
- 6150 Taylorsville Rd
- 5904 Troy Villa Blvd Unit 20051
- 5082 Ashview Ct
- 5071 Ashview Ct
- 7321 Huntsview Ct
- 7311 Huntsview Ct
- 5031 Bluffview Dr
- 5041 Bluffview Dr
- 7331 Huntsview Ct
- 5021 Bluffview Dr
- 5061 Ashview Ct
- 5051 Bluffview Dr
- 5072 Ashview Ct
- 7341 Huntsview Ct
- 5011 Bluffview Dr
- 5062 Ashview Ct
- 7351 Huntsview Ct
- 5051 Ashview Ct
- 7320 Huntsview Ct
- 5052 Ashview Ct
- 7330 Huntsview Ct
- 7310 Huntsview Ct