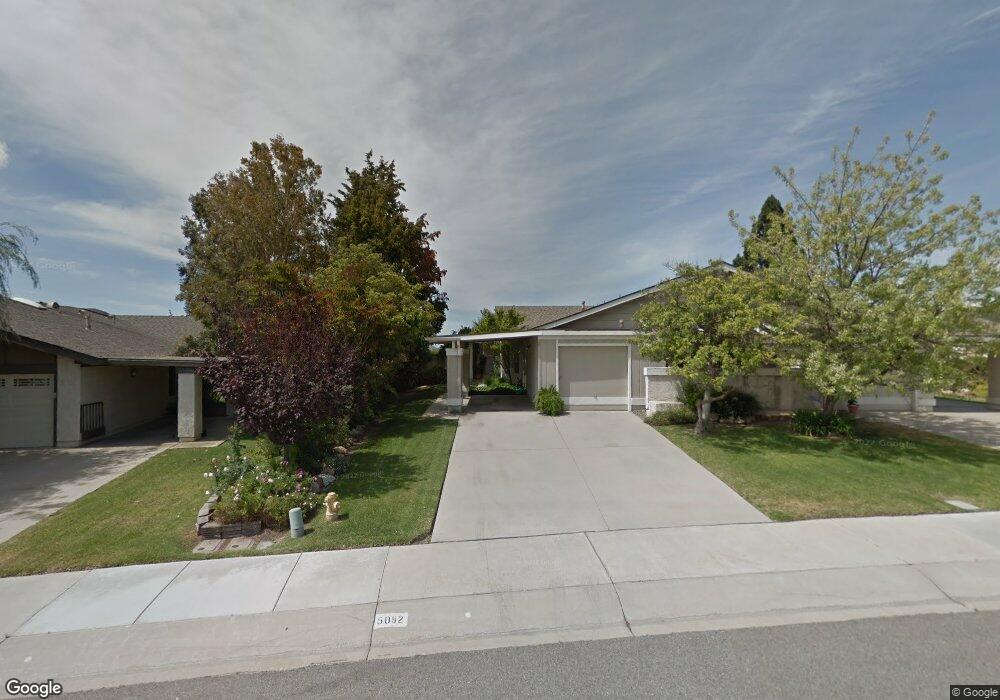
5082 Creekside Rd Camarillo, CA 93012
Estimated Value: $703,498 - $828,000
3
Beds
2
Baths
1,503
Sq Ft
$516/Sq Ft
Est. Value
About This Home
This home is located at 5082 Creekside Rd, Camarillo, CA 93012 and is currently estimated at $774,875, approximately $515 per square foot. 5082 Creekside Rd is a home located in Ventura County with nearby schools including Tierra Linda Elementary School, Las Colinas Middle School, and Adolfo Camarillo High School.
Ownership History
Date
Name
Owned For
Owner Type
Purchase Details
Closed on
Jan 29, 2020
Sold by
Goodwin Linda M
Bought by
Goodwin Linda M and The Linda M Goodwin Living Tru
Current Estimated Value
Purchase Details
Closed on
Jan 24, 2020
Sold by
Guimond Suzanne M
Bought by
Guimond Suzanne M and The Suzanne M Guimond Living T
Purchase Details
Closed on
Oct 2, 2019
Sold by
Guimond Thelma Louise and The Thelma Louise Guimond Livi
Bought by
Goodwin Linda Marie and Guimond Suzanne Marie
Purchase Details
Closed on
Nov 30, 2005
Sold by
Guimond Thelma
Bought by
The Thelma Louise Guimond Living Trust and Guimond Thelma Louise
Purchase Details
Closed on
Nov 1, 1995
Sold by
Norman Guimond
Bought by
Guimond Norman and Guimond Thelma
Create a Home Valuation Report for This Property
The Home Valuation Report is an in-depth analysis detailing your home's value as well as a comparison with similar homes in the area
Home Values in the Area
Average Home Value in this Area
Purchase History
| Date | Buyer | Sale Price | Title Company |
|---|---|---|---|
| Goodwin Linda M | -- | None Available | |
| Guimond Suzanne M | -- | None Available | |
| Goodwin Linda Marie | -- | None Available | |
| The Thelma Louise Guimond Living Trust | -- | -- | |
| Guimond Norman | -- | -- |
Source: Public Records
Tax History
| Year | Tax Paid | Tax Assessment Tax Assessment Total Assessment is a certain percentage of the fair market value that is determined by local assessors to be the total taxable value of land and additions on the property. | Land | Improvement |
|---|---|---|---|---|
| 2025 | $1,754 | $160,660 | $38,464 | $122,196 |
| 2024 | $1,754 | $157,510 | $37,710 | $119,800 |
| 2023 | $1,691 | $154,422 | $36,971 | $117,451 |
| 2022 | $1,684 | $151,395 | $36,246 | $115,149 |
| 2021 | $1,623 | $148,427 | $35,535 | $112,892 |
| 2020 | $1,616 | $146,908 | $35,172 | $111,736 |
| 2019 | $1,684 | $144,029 | $34,483 | $109,546 |
| 2018 | $1,653 | $141,206 | $33,807 | $107,399 |
| 2017 | $1,558 | $138,439 | $33,145 | $105,294 |
| 2016 | $1,522 | $135,726 | $32,496 | $103,230 |
| 2015 | $1,506 | $133,689 | $32,009 | $101,680 |
| 2014 | $1,472 | $131,072 | $31,383 | $99,689 |
Source: Public Records
Map
Nearby Homes
- 4864 Paseo Montelena
- 472 Madreselva Ct
- 499 Sobre Colinas Place
- 5154 Village 5
- 5211 Village 5
- 5142 Village 5
- 3225 Village 3
- 5072 Via Calderon
- 7115 Village 7 Unit 7
- 74 Caleta Dr Unit 162
- 7177 Village 7
- 1329 La Culebra Cir
- 4208 Village 4
- 1425 Calle Lozano
- 4696 Refugio Ct
- 59 Caleta Dr Unit 177
- 7202 Village 7 Unit 7
- 182 Rancho Adolfo Dr Unit 83
- 27 Tahquitz Dr Unit 226
- 6204 Village 6
- 5074 Creekside Rd
- 5086 Creekside Rd
- 892 Laurel Park Cir
- 5070 Creekside Rd
- 5094 Creekside Rd
- 876 Laurel Park Cir
- 5098 Creekside Rd
- 5083 Creekside Rd
- 5081 Laurel Park Dr
- 5075 Creekside Rd
- 5095 Creekside Rd
- 5062 Creekside Rd
- 5104 Creekside Rd
- 5073 Laurel Park Dr
- 891 Laurel Park Cir
- 5085 Laurel Park Dr
- 5067 Creekside Rd
- 5063 Laurel Park Dr
- 5093 Laurel Park Dr
- 860 Laurel Park Cir Unit 111D
Your Personal Tour Guide
Ask me questions while you tour the home.