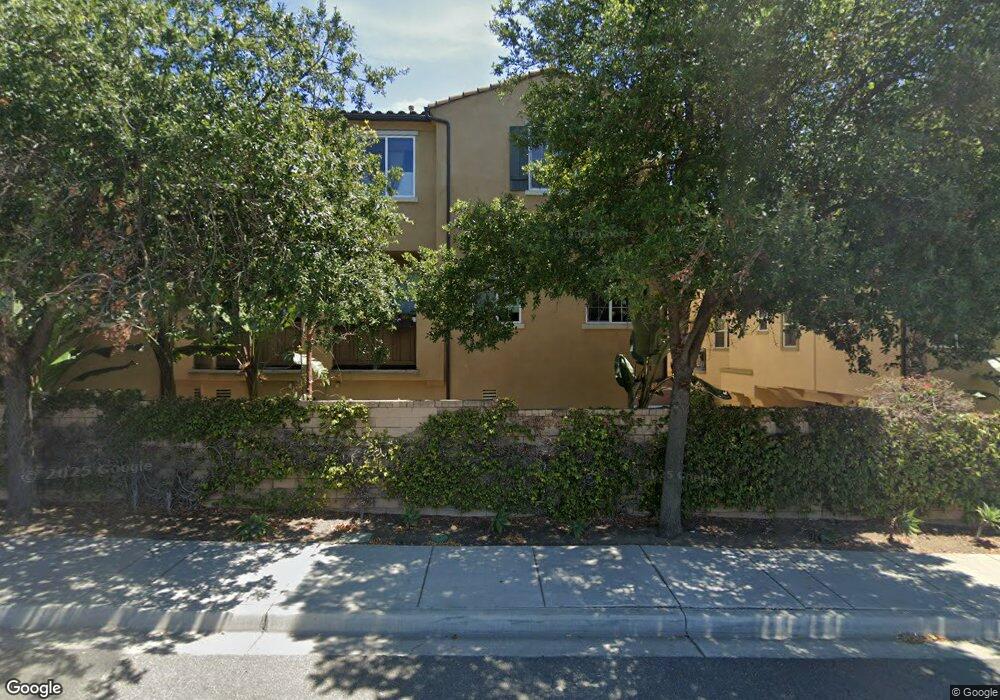
5084 Tranquil Way #103 Unit 103 Oceanside, CA 92057
North Valley NeighborhoodEstimated Value: $555,832 - $602,000
2
Beds
3
Baths
1,132
Sq Ft
$512/Sq Ft
Est. Value
About This Home
This home is located at 5084 Tranquil Way #103 Unit 103, Oceanside, CA 92057 and is currently estimated at $579,958, approximately $512 per square foot. 5084 Tranquil Way #103 Unit 103 is a home located in San Diego County with nearby schools including Del Rio Elementary School, Cesar Chavez Middle School, and El Camino High School.
Ownership History
Date
Name
Owned For
Owner Type
Purchase Details
Closed on
Jan 6, 2020
Sold by
Garcia Anika T
Bought by
Flores Jennifer A and Flores Jesus
Current Estimated Value
Home Financials for this Owner
Home Financials are based on the most recent Mortgage that was taken out on this home.
Original Mortgage
$375,250
Outstanding Balance
$331,548
Interest Rate
3.6%
Mortgage Type
New Conventional
Estimated Equity
$248,410
Purchase Details
Closed on
Feb 18, 2016
Sold by
Brown Rick and Brown Cheri
Bought by
Garcia Anika T
Home Financials for this Owner
Home Financials are based on the most recent Mortgage that was taken out on this home.
Original Mortgage
$309,294
Interest Rate
3.72%
Mortgage Type
FHA
Purchase Details
Closed on
Aug 10, 2012
Sold by
Taylor Morrison Of California Llc
Bought by
Brown Rick and Brown Cheri
Home Financials for this Owner
Home Financials are based on the most recent Mortgage that was taken out on this home.
Original Mortgage
$235,778
Interest Rate
3.55%
Mortgage Type
FHA
Create a Home Valuation Report for This Property
The Home Valuation Report is an in-depth analysis detailing your home's value as well as a comparison with similar homes in the area
Home Values in the Area
Average Home Value in this Area
Purchase History
| Date | Buyer | Sale Price | Title Company |
|---|---|---|---|
| Flores Jennifer A | $395,000 | Lawyers Title | |
| Garcia Anika T | $315,000 | Wfg National Title Company | |
| Brown Rick | $240,500 | First American Title Company |
Source: Public Records
Mortgage History
| Date | Status | Borrower | Loan Amount |
|---|---|---|---|
| Open | Flores Jennifer A | $375,250 | |
| Previous Owner | Garcia Anika T | $309,294 | |
| Previous Owner | Brown Rick | $235,778 |
Source: Public Records
Tax History
| Year | Tax Paid | Tax Assessment Tax Assessment Total Assessment is a certain percentage of the fair market value that is determined by local assessors to be the total taxable value of land and additions on the property. | Land | Improvement |
|---|---|---|---|---|
| 2025 | $4,770 | $431,986 | $197,888 | $234,098 |
| 2024 | $4,770 | $423,516 | $194,008 | $229,508 |
| 2023 | $4,623 | $415,212 | $190,204 | $225,008 |
| 2022 | $4,553 | $407,072 | $186,475 | $220,597 |
| 2021 | $4,571 | $399,091 | $182,819 | $216,272 |
| 2020 | $3,829 | $340,961 | $156,190 | $184,771 |
| 2019 | $3,718 | $334,277 | $153,128 | $181,149 |
| 2018 | $3,600 | $327,724 | $150,126 | $177,598 |
| 2017 | $3,533 | $321,299 | $147,183 | $174,116 |
| 2016 | $2,700 | $249,786 | $114,424 | $135,362 |
| 2015 | $2,620 | $246,035 | $112,706 | $133,329 |
| 2014 | $2,518 | $241,217 | $110,499 | $130,718 |
Source: Public Records
Map
Nearby Homes
- 5063 Waterview Way Unit 101
- 5063 Waterview Way
- 5063 Waterview Way Unit 102
- 5065 Waterview Way Unit 101
- 5065 Waterview Way
- 4950 Luna Dr
- 5033 Los Morros Way Unit 55
- 5034 Los Morros Way Unit 62
- 4918 Roja Dr
- 150 N River Cir Unit 105
- 4924 Verde Dr
- 5108 Andrew Jackson St
- 5015 Macario Dr
- 569 Gold Dr
- 185 Harrison St
- 4795 Claire Dr
- 4889 Tarragon Dr
- 4745 Marblehead Bay Dr
- 4781 Calle Las Positas
- 4798 Calle Los Santos
- 5080 Tranquil Way Unit 104
- 5080 Tranquil Way Unit 101
- 5076 Tranquil Way
- 5084 Tranquil Way Unit 104
- 5084 Tranquil Way
- 5080 Tranquil Way
- 5076 Tranquil Way Unit 101
- 5084 Tranquil Way Unit 101
- 5080 Tranquil Way Unit 103
- 5080 Tranquil Way Unit 104
- 5080 Tranquil Way Unit 102
- 5084 Tranquil Way Unit 103
- 5083 Tranquil Way Unit 102
- 5083 Tranquil Way Unit 104
- 5074 Cascade Way
- 5070 Cascade Way Unit 101
- 5074 Cascade Way Unit 104
- 5074 Cascade Way Unit 101
- 5070 Cascade Way Unit 102
- 5070 Cascade Way Unit 103
Your Personal Tour Guide
Ask me questions while you tour the home.