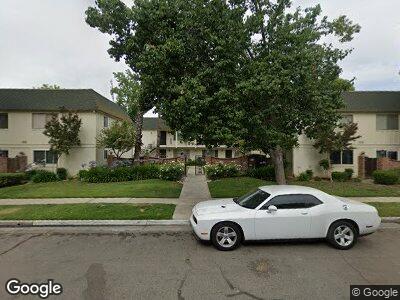
5085 N Wishon Ave Unit 13 Fresno, CA 93704
Bullard NeighborhoodEstimated Value: $201,299 - $242,000
2
Beds
1
Bath
900
Sq Ft
$240/Sq Ft
Est. Value
About This Home
This home is located at 5085 N Wishon Ave Unit 13, Fresno, CA 93704 and is currently estimated at $216,075, approximately $240 per square foot. 5085 N Wishon Ave Unit 13 is a home located in Fresno County with nearby schools including Kratt Elementary School, Tenaya Middle School, and Bullard High School.
Ownership History
Date
Name
Owned For
Owner Type
Purchase Details
Closed on
Jun 21, 2019
Sold by
Tilley Seth D
Bought by
Olgin Joaquin Diego
Current Estimated Value
Home Financials for this Owner
Home Financials are based on the most recent Mortgage that was taken out on this home.
Original Mortgage
$130,950
Outstanding Balance
$117,074
Interest Rate
3.9%
Mortgage Type
New Conventional
Estimated Equity
$105,603
Purchase Details
Closed on
Nov 12, 2009
Sold by
Cross George M
Bought by
Tilley Seth D
Home Financials for this Owner
Home Financials are based on the most recent Mortgage that was taken out on this home.
Original Mortgage
$60,000
Interest Rate
5.01%
Mortgage Type
New Conventional
Purchase Details
Closed on
Feb 20, 1996
Sold by
Carrey Robyn and Roberts Jean G
Bought by
Cross Helen
Create a Home Valuation Report for This Property
The Home Valuation Report is an in-depth analysis detailing your home's value as well as a comparison with similar homes in the area
Home Values in the Area
Average Home Value in this Area
Purchase History
| Date | Buyer | Sale Price | Title Company |
|---|---|---|---|
| Olgin Joaquin Diego | $135,000 | Chicago Title Company | |
| Tilley Seth D | $80,000 | Fidelity National Title Co | |
| Cross Helen | $51,000 | Stewart Title |
Source: Public Records
Mortgage History
| Date | Status | Borrower | Loan Amount |
|---|---|---|---|
| Open | Olgin Joaquin Diego | $130,950 | |
| Previous Owner | Tilley Seth D | $60,000 |
Source: Public Records
Tax History Compared to Growth
Tax History
| Year | Tax Paid | Tax Assessment Tax Assessment Total Assessment is a certain percentage of the fair market value that is determined by local assessors to be the total taxable value of land and additions on the property. | Land | Improvement |
|---|---|---|---|---|
| 2023 | $1,777 | $141,906 | $34,687 | $107,219 |
| 2022 | $1,753 | $139,124 | $34,007 | $105,117 |
| 2021 | $1,705 | $136,397 | $33,341 | $103,056 |
| 2020 | $1,698 | $135,000 | $33,000 | $102,000 |
| 2019 | $1,149 | $92,564 | $23,139 | $69,425 |
| 2018 | $1,124 | $90,750 | $22,686 | $68,064 |
| 2017 | $1,105 | $88,972 | $22,242 | $66,730 |
| 2016 | $982 | $80,000 | $20,000 | $60,000 |
| 2015 | $898 | $73,000 | $19,000 | $54,000 |
| 2014 | $897 | $73,000 | $19,000 | $54,000 |
Source: Public Records
Map
Nearby Homes
- 5090 N Roosevelt Ave Unit 6
- 5180 N Wishon Ave Unit 201
- 524 W Keats Ave
- 5338 N Colonial Ave Unit 101
- 5118 N Harrison Ave
- 5090 N College Ave Unit 104
- 520 W Barstow Ave
- 5231 N Del Mar Ave
- 1140 E Alamos Ave
- 5492 N Wilson Ave
- 4810 N Del Mar Ave
- 1264 W Twain Ave
- 820 E Gettysburg Ave
- 315 E Gettysburg Ave
- 4654 N Harrison Ave
- 1324 W San Jose Ave
- 71 E Gettysburg Ave
- 5657 N Colonial Ave
- 1048 W Browning Ave Unit B
- 5110 N Fruit Ave Unit 127
- 5085 N Wishon Ave
- 5085 N Wishon Ave Unit 39
- 5085 N Wishon Ave Unit 17
- 5085 N Wishon Ave Unit 41
- 5085 N Wishon Ave Unit 23
- 5085 N Wishon Ave Unit 45
- 5085 N Wishon Ave Unit 20
- 5085 N Wishon Ave Unit 19
- 5085 N Wishon Ave Unit 18
- 5085 N Wishon Ave Unit 16
- 5085 N Wishon Ave Unit 40
- 5085 N Wishon Ave Unit 21
- 5085 N Wishon Ave Unit 15
- 5085 N Wishon Ave Unit 46
- 5085 N Wishon Ave Unit 38
- 5085 N Wishon Ave Unit 37
- 5085 N Wishon Ave Unit 24
- 5085 N Wishon Ave Unit 13
- 5085 N Wishon Ave Unit 48
- 5085 N Wishon Ave Unit 44