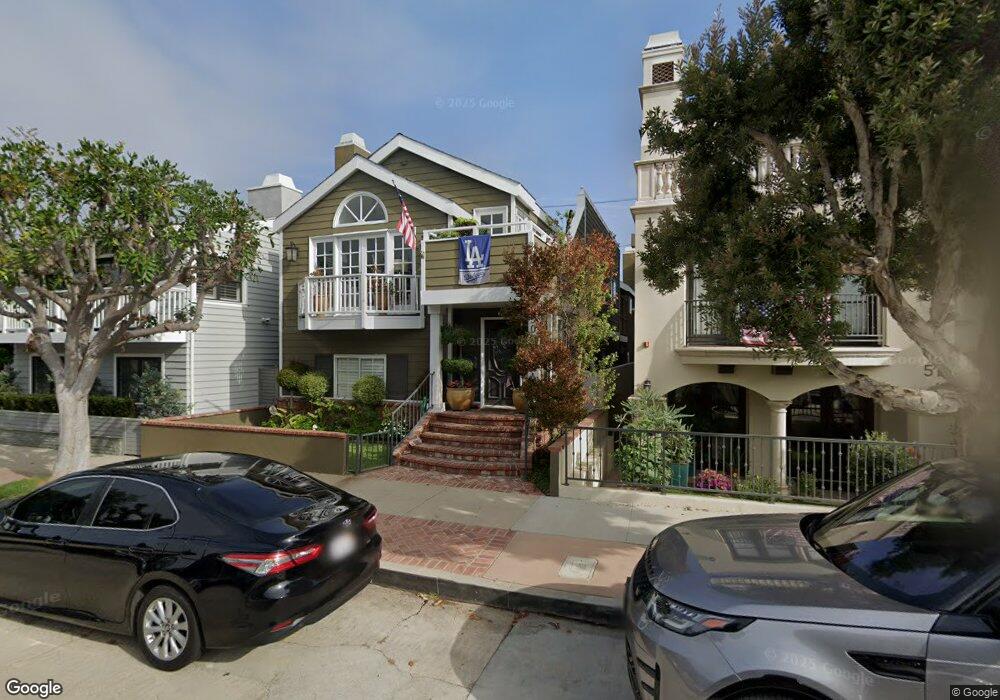
509 3rd St Manhattan Beach, CA 90266
Estimated Value: $3,705,000 - $6,425,000
3
Beds
3
Baths
3,576
Sq Ft
$1,247/Sq Ft
Est. Value
About This Home
This home is located at 509 3rd St, Manhattan Beach, CA 90266 and is currently estimated at $4,458,537, approximately $1,246 per square foot. 509 3rd St is a home located in Los Angeles County with nearby schools including Opal Robinson Elementary School, Manhattan Beach Middle School, and Mira Costa High School.
Ownership History
Date
Name
Owned For
Owner Type
Purchase Details
Closed on
Jul 15, 2013
Sold by
Vanremmen Roger
Bought by
Vanremmen Roger and The Van Remmen Living Trust
Current Estimated Value
Home Financials for this Owner
Home Financials are based on the most recent Mortgage that was taken out on this home.
Original Mortgage
$1,410,000
Interest Rate
4.46%
Mortgage Type
New Conventional
Purchase Details
Closed on
Mar 6, 2008
Sold by
Vanremmen Roger
Bought by
Vanremmen Roger and Van Remmen Living Trust
Home Financials for this Owner
Home Financials are based on the most recent Mortgage that was taken out on this home.
Original Mortgage
$500,000
Interest Rate
5.65%
Mortgage Type
Credit Line Revolving
Purchase Details
Closed on
May 23, 2006
Sold by
Vanremmen Roger
Bought by
Vanremmen Roger and Van Remmen Living Trust
Purchase Details
Closed on
Jul 6, 2005
Sold by
Vanremmen Roger
Bought by
Vanremmen Roger
Home Financials for this Owner
Home Financials are based on the most recent Mortgage that was taken out on this home.
Original Mortgage
$650,000
Interest Rate
5.37%
Mortgage Type
Purchase Money Mortgage
Purchase Details
Closed on
Apr 10, 2002
Sold by
Vanremmen Roger
Bought by
Vanremmen Roger and The Vanremmen Living Trust
Purchase Details
Closed on
Feb 14, 2001
Sold by
David Barbara
Bought by
Vanremmen Roger
Home Financials for this Owner
Home Financials are based on the most recent Mortgage that was taken out on this home.
Original Mortgage
$465,000
Interest Rate
7%
Purchase Details
Closed on
Feb 21, 1997
Sold by
Sterne Victor W
Bought by
Vanremmen Roger
Home Financials for this Owner
Home Financials are based on the most recent Mortgage that was taken out on this home.
Original Mortgage
$350,000
Interest Rate
7.12%
Create a Home Valuation Report for This Property
The Home Valuation Report is an in-depth analysis detailing your home's value as well as a comparison with similar homes in the area
Home Values in the Area
Average Home Value in this Area
Purchase History
| Date | Buyer | Sale Price | Title Company |
|---|---|---|---|
| Vanremmen Roger | -- | Old Republic Title Company | |
| Vanremmen Roger | -- | Old Republic Title Company | |
| Vanremmen Roger | -- | Ortc | |
| Vanremmen Roger | -- | Lawyers Title Company | |
| Vanremmen Roger | -- | None Available | |
| Vanremmen Roger | -- | Progressive Title | |
| Vanremmen Roger | -- | -- | |
| Vanremmen Roger | -- | Lawyers Title Company | |
| Vanremmen Roger | $750,000 | Southland Title |
Source: Public Records
Mortgage History
| Date | Status | Borrower | Loan Amount |
|---|---|---|---|
| Closed | Vanremmen Roger | $1,410,000 | |
| Closed | Vanremmen Roger | $500,000 | |
| Closed | Vanremmen Roger | $650,000 | |
| Closed | Vanremmen Roger | $465,000 | |
| Previous Owner | Vanremmen Roger | $350,000 | |
| Closed | Vanremmen Roger | $100,000 | |
| Closed | Vanremmen Roger | $120,000 |
Source: Public Records
Tax History
| Year | Tax Paid | Tax Assessment Tax Assessment Total Assessment is a certain percentage of the fair market value that is determined by local assessors to be the total taxable value of land and additions on the property. | Land | Improvement |
|---|---|---|---|---|
| 2025 | $13,852 | $1,221,511 | $771,185 | $450,326 |
| 2024 | $13,852 | $1,197,561 | $756,064 | $441,497 |
| 2023 | $13,440 | $1,174,081 | $741,240 | $432,841 |
| 2022 | $13,207 | $1,151,060 | $726,706 | $424,354 |
| 2021 | $12,992 | $1,128,491 | $712,457 | $416,034 |
| 2020 | $12,870 | $1,116,921 | $705,152 | $411,769 |
| 2019 | $12,641 | $1,095,022 | $691,326 | $403,696 |
| 2018 | $12,356 | $1,073,552 | $677,771 | $395,781 |
| 2016 | $11,581 | $1,031,866 | $651,453 | $380,413 |
| 2015 | $11,343 | $1,016,367 | $641,668 | $374,699 |
| 2014 | $11,189 | $996,459 | $629,099 | $367,360 |
Source: Public Records
Map
Nearby Homes
- 436 1st St
- 98 Highland Ave
- 212 Manhattan Ave
- 89 Bayview Dr
- 621 6th St
- 109 S Poinsettia Ave
- 215 S Poinsettia Ave
- 121 35th St
- 231 Longfellow Ave
- 500 N Poinsettia Ave
- 626 Longfellow Ave
- 921 Highland Ave
- 337 10th St
- 920 The Strand
- 1000 The Strand
- 124 11th St
- 927 9th St
- 525 Manhattan Beach Blvd
- 1140 Fisher Ave
- 2965 La Carlita St
Your Personal Tour Guide
Ask me questions while you tour the home.