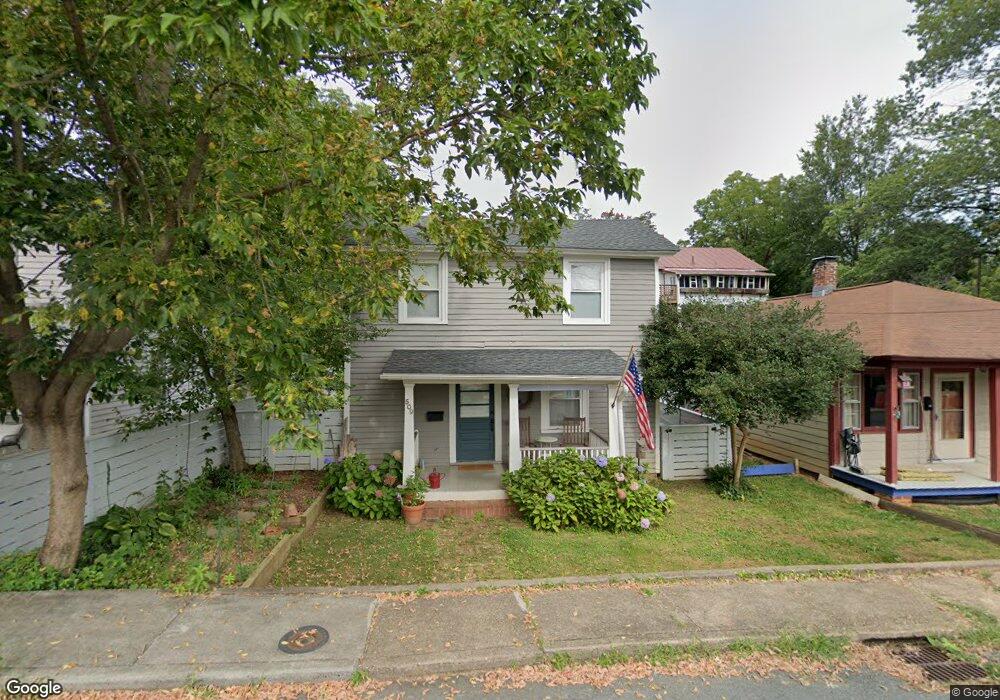
509 8th St NE Charlottesville, VA 22902
North Downtown NeighborhoodEstimated Value: $526,000 - $731,000
2
Beds
3
Baths
1,169
Sq Ft
$506/Sq Ft
Est. Value
About This Home
This home is located at 509 8th St NE, Charlottesville, VA 22902 and is currently estimated at $591,412, approximately $505 per square foot. 509 8th St NE is a home located in Charlottesville City with nearby schools including Burnley-Moran Elementary School, Buford Middle School, and Charlottesville High School.
Ownership History
Date
Name
Owned For
Owner Type
Purchase Details
Closed on
Jun 22, 2017
Sold by
Barzun Charles L
Bought by
Welch Conor T and Coccomo Danielle
Current Estimated Value
Home Financials for this Owner
Home Financials are based on the most recent Mortgage that was taken out on this home.
Original Mortgage
$308,000
Outstanding Balance
$256,402
Interest Rate
4.05%
Mortgage Type
New Conventional
Estimated Equity
$335,010
Purchase Details
Closed on
Jun 2, 2008
Bought by
Barzun Charles L
Create a Home Valuation Report for This Property
The Home Valuation Report is an in-depth analysis detailing your home's value as well as a comparison with similar homes in the area
Home Values in the Area
Average Home Value in this Area
Purchase History
| Date | Buyer | Sale Price | Title Company |
|---|---|---|---|
| Welch Conor T | $385,000 | Chicago Title Ins Co | |
| Barzun Charles L | $320,000 | -- |
Source: Public Records
Mortgage History
| Date | Status | Borrower | Loan Amount |
|---|---|---|---|
| Open | Welch Conor T | $308,000 |
Source: Public Records
Tax History Compared to Growth
Tax History
| Year | Tax Paid | Tax Assessment Tax Assessment Total Assessment is a certain percentage of the fair market value that is determined by local assessors to be the total taxable value of land and additions on the property. | Land | Improvement |
|---|---|---|---|---|
| 2025 | $5,177 | $523,900 | $200,000 | $323,900 |
| 2024 | $5,177 | $482,700 | $176,000 | $306,700 |
| 2023 | $4,559 | $471,900 | $176,000 | $295,900 |
| 2022 | $4,292 | $444,100 | $168,000 | $276,100 |
| 2021 | $3,978 | $415,700 | $150,000 | $265,700 |
| 2020 | $3,696 | $386,000 | $132,000 | $254,000 |
| 2019 | $3,612 | $377,200 | $128,200 | $249,000 |
| 2018 | $1,670 | $348,600 | $111,500 | $237,100 |
| 2017 | $2,814 | $293,200 | $101,400 | $191,800 |
| 2016 | $2,662 | $277,200 | $92,200 | $185,000 |
| 2015 | $2,488 | $277,200 | $92,200 | $185,000 |
| 2014 | $2,488 | $261,900 | $82,300 | $179,600 |
Source: Public Records
Map
Nearby Homes
- 619 E High St
- 619 E High St Unit 2
- 615 E High St
- 409 Park St
- 801 E Jefferson St
- 501 Lexington Ave
- 500 Court Square Unit 901
- 500 Court Square Unit 503 AND 504
- 249 E Jefferson St Unit 2526
- 253 E Jefferson St Unit 27
- 408 E Market St Unit 305
- 503 2nd St NE
- 210 10th St NE Unit 103
- 112 5th St SE Unit 3D
- 112 5th St SE Unit 5A
- 320 11th St NE
- 511 N 1st St Unit 613
- 511 N 1st St Unit 105
