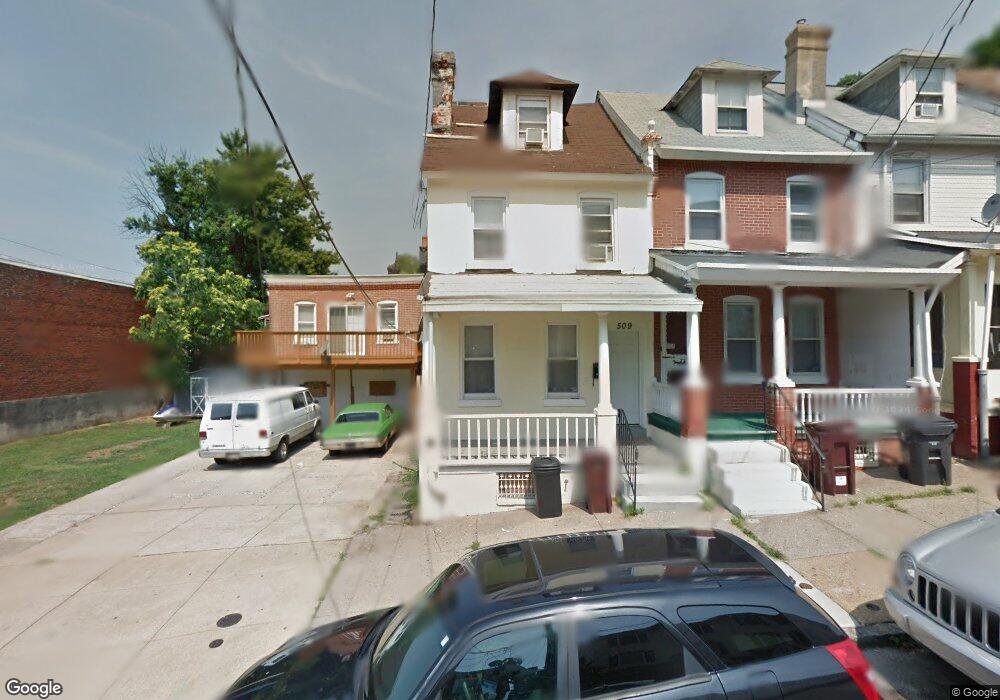
509 Delamore Place Wilmington, DE 19805
Estimated Value: $164,000 - $200,000
4
Beds
2
Baths
1,400
Sq Ft
$129/Sq Ft
Est. Value
About This Home
This home is located at 509 Delamore Place, Wilmington, DE 19805 and is currently estimated at $180,188, approximately $128 per square foot. 509 Delamore Place is a home located in New Castle County with nearby schools including Warner Elementary School, Dupont (H.B.) Middle School, and Alexis I. du Pont High School.
Ownership History
Date
Name
Owned For
Owner Type
Purchase Details
Closed on
Sep 3, 2021
Sold by
Magnet Realty Inc
Bought by
Bantum Norma L
Current Estimated Value
Home Financials for this Owner
Home Financials are based on the most recent Mortgage that was taken out on this home.
Original Mortgage
$142,373
Outstanding Balance
$129,549
Interest Rate
2.8%
Mortgage Type
FHA
Estimated Equity
$50,639
Purchase Details
Closed on
Jan 4, 2010
Sold by
Jpmorgan Chase Bank National Association
Bought by
Magnet Realty Inc
Purchase Details
Closed on
May 18, 2005
Sold by
Delamore Equity Llc
Bought by
Marchiani Ronald J
Purchase Details
Closed on
Mar 25, 2004
Sold by
Walkup Richard L
Bought by
Delamore Equity Llc
Create a Home Valuation Report for This Property
The Home Valuation Report is an in-depth analysis detailing your home's value as well as a comparison with similar homes in the area
Home Values in the Area
Average Home Value in this Area
Purchase History
| Date | Buyer | Sale Price | Title Company |
|---|---|---|---|
| Bantum Norma L | $145,000 | None Available | |
| Magnet Realty Inc | $20,000 | None Available | |
| Marchiani Ronald J | $68,000 | -- | |
| Delamore Equity Llc | -- | -- |
Source: Public Records
Mortgage History
| Date | Status | Borrower | Loan Amount |
|---|---|---|---|
| Open | Bantum Norma L | $142,373 |
Source: Public Records
Tax History Compared to Growth
Tax History
| Year | Tax Paid | Tax Assessment Tax Assessment Total Assessment is a certain percentage of the fair market value that is determined by local assessors to be the total taxable value of land and additions on the property. | Land | Improvement |
|---|---|---|---|---|
| 2024 | $699 | $22,400 | $2,700 | $19,700 |
| 2023 | $607 | $22,400 | $2,700 | $19,700 |
| 2022 | $610 | $22,400 | $2,700 | $19,700 |
| 2021 | $8,515 | $22,400 | $2,700 | $19,700 |
| 2020 | $7,340 | $22,400 | $2,700 | $19,700 |
| 2019 | $1,063 | $22,400 | $2,700 | $19,700 |
| 2018 | $810 | $22,400 | $2,700 | $19,700 |
| 2017 | $993 | $22,400 | $2,700 | $19,700 |
| 2016 | $993 | $22,400 | $2,700 | $19,700 |
| 2015 | $949 | $22,400 | $2,700 | $19,700 |
| 2014 | $901 | $22,400 | $2,700 | $19,700 |
Source: Public Records
Map
Nearby Homes
- 506 Delamore Place
- 415 N Clayton St
- 517 Delamore Place
- 407 N Rodney St
- 1604 W 4th St
- 1625 W 4th St
- 307 N Rodney St
- 1409 W 4th St
- 1626 W 4th St
- 1631 W 3rd St
- 1407 W 6th St
- 1700 W 5th St
- 1707 W 4th St
- 227 N Broom St
- 200 N Rodney St
- 614 N Broom St
- 404 N Scott St
- 201 N Rodney St
- 1318 W 6th St
- 1308 W 5th St
- 505 Delamore Place
- 513 Delamore Place
- 501 Delamore Place
- 508 N Clayton St
- 506 N Clayton St
- 510 N Clayton St
- 519 Delamore Place
- 504 N Clayton St
- 512 N Clayton St
- 502 N Clayton St
- 514 N Clayton St
- 500 N Clayton St
- 516 N Clayton St
- 518 N Clayton St
- 504 Delamore Place
- 510 Delamore Place
- 502 Delamore Place
- 520 N Clayton St
- 500 Delamore Place
- 512 Delamore Place