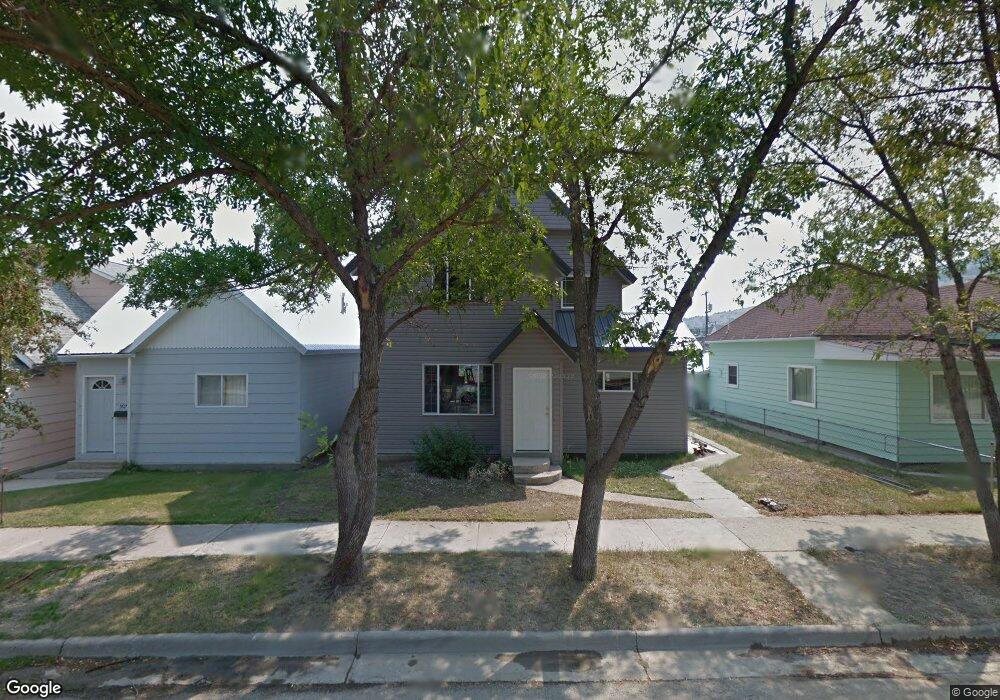
509 Elm St Anaconda, MT 59711
Estimated Value: $262,000 - $350,000
5
Beds
2
Baths
1,838
Sq Ft
$163/Sq Ft
Est. Value
About This Home
This home is located at 509 Elm St, Anaconda, MT 59711 and is currently estimated at $300,356, approximately $163 per square foot. 509 Elm St is a home located in Deer Lodge County with nearby schools including Lincoln Elementary School, Fred Moodry Intermediate School, and Anaconda Junior High School.
Ownership History
Date
Name
Owned For
Owner Type
Purchase Details
Closed on
Sep 2, 2010
Sold by
Burke Tyrone
Bought by
Martelli John
Current Estimated Value
Home Financials for this Owner
Home Financials are based on the most recent Mortgage that was taken out on this home.
Original Mortgage
$28,000
Outstanding Balance
$18,555
Interest Rate
4.51%
Mortgage Type
Purchase Money Mortgage
Estimated Equity
$281,801
Purchase Details
Closed on
Jun 24, 2010
Sold by
Moses James D and Moses Karen L
Bought by
Burke Tyrone
Create a Home Valuation Report for This Property
The Home Valuation Report is an in-depth analysis detailing your home's value as well as a comparison with similar homes in the area
Home Values in the Area
Average Home Value in this Area
Purchase History
| Date | Buyer | Sale Price | Title Company |
|---|---|---|---|
| Martelli John | -- | First American Title Company | |
| Burke Tyrone | -- | First American Title Company |
Source: Public Records
Mortgage History
| Date | Status | Borrower | Loan Amount |
|---|---|---|---|
| Open | Martelli John | $28,000 |
Source: Public Records
Tax History Compared to Growth
Tax History
| Year | Tax Paid | Tax Assessment Tax Assessment Total Assessment is a certain percentage of the fair market value that is determined by local assessors to be the total taxable value of land and additions on the property. | Land | Improvement |
|---|---|---|---|---|
| 2025 | $1,950 | $256,300 | $0 | $0 |
| 2024 | $2,042 | $178,600 | $0 | $0 |
| 2023 | $1,867 | $178,600 | $0 | $0 |
| 2022 | $1,727 | $116,100 | $0 | $0 |
| 2021 | $1,273 | $116,100 | $0 | $0 |
| 2020 | $1,648 | $106,398 | $0 | $0 |
| 2019 | $1,762 | $106,418 | $0 | $0 |
| 2018 | $1,689 | $101,000 | $0 | $0 |
| 2017 | $1,091 | $101,000 | $0 | $0 |
| 2016 | $1,638 | $97,770 | $0 | $0 |
| 2015 | $1,328 | $114,730 | $0 | $0 |
| 2014 | $799 | $39,072 | $0 | $0 |
Source: Public Records
Map
Nearby Homes
- 415 W 6th St
- 411 Pine St
- 506 W 3rd St
- 411 W 7th St
- 706 Locust St
- 412 W Park Ave
- 200 Hickory St Unit 23
- 516 W Park Ave
- 104 & 106 Elm St
- 903 W 3rd St
- 624 Cherry St
- 312 E 4th St
- 709 Cherry St
- 1104 W 4th St
- 310 Chestnut St
- 804 Birch St
- 505 E Pennsylvania St
- 520 E Pennsylvania St Unit 11
- 520 E Pennsylvania St Unit 10
- 520 E Pennsylvania St Unit 4