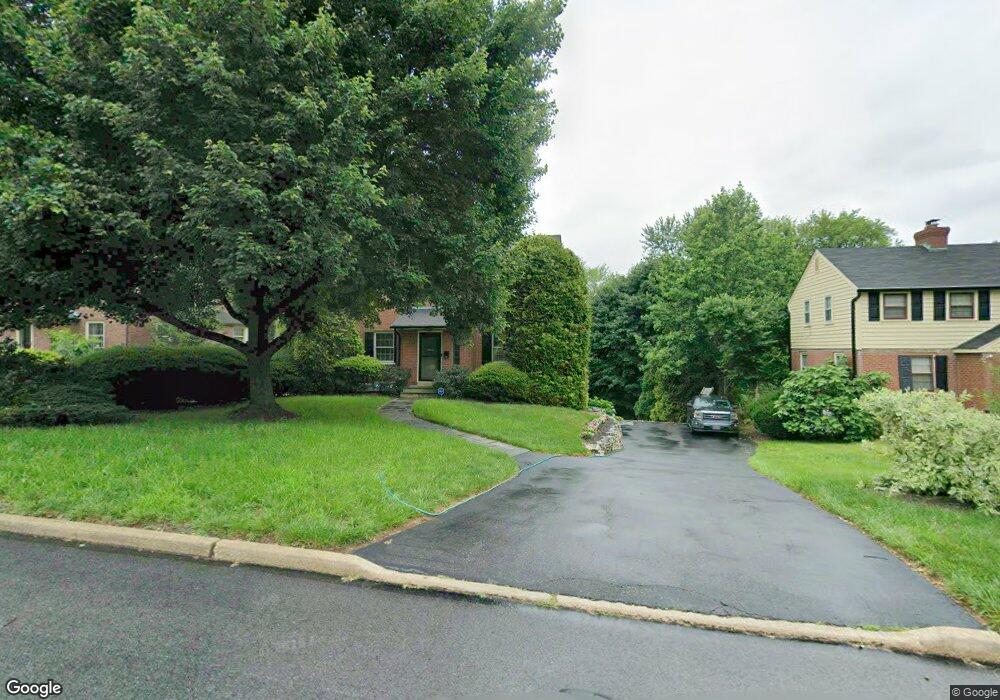
509 Lindley Rd Glenside, PA 19038
Estimated Value: $443,011 - $538,000
3
Beds
2
Baths
1,550
Sq Ft
$323/Sq Ft
Est. Value
About This Home
This home is located at 509 Lindley Rd, Glenside, PA 19038 and is currently estimated at $500,503, approximately $322 per square foot. 509 Lindley Rd is a home located in Montgomery County with nearby schools including Elkins Park School, Cedarbrook Middle School, and Cheltenham High School.
Ownership History
Date
Name
Owned For
Owner Type
Purchase Details
Closed on
Jun 24, 2010
Sold by
Weychert M Gabrielle and Saunders Joseph P
Bought by
Saunders M Gabrielle and Saunders Joseph P
Current Estimated Value
Home Financials for this Owner
Home Financials are based on the most recent Mortgage that was taken out on this home.
Original Mortgage
$138,700
Outstanding Balance
$92,086
Interest Rate
4.78%
Estimated Equity
$408,417
Purchase Details
Closed on
Jul 28, 2006
Sold by
Mccullough David M and Mccullough Meghan K
Bought by
Weychert M Gabrielle and Saunders Joseph P
Home Financials for this Owner
Home Financials are based on the most recent Mortgage that was taken out on this home.
Original Mortgage
$170,000
Interest Rate
6.8%
Purchase Details
Closed on
Jul 30, 1999
Sold by
Wennerberg Thomas M and Wennerberg Patricia A
Bought by
Mccullough David M and Mccullough Meghan K
Create a Home Valuation Report for This Property
The Home Valuation Report is an in-depth analysis detailing your home's value as well as a comparison with similar homes in the area
Home Values in the Area
Average Home Value in this Area
Purchase History
| Date | Buyer | Sale Price | Title Company |
|---|---|---|---|
| Saunders M Gabrielle | -- | None Available | |
| Weychert M Gabrielle | $355,000 | None Available | |
| Mccullough David M | $179,800 | -- |
Source: Public Records
Mortgage History
| Date | Status | Borrower | Loan Amount |
|---|---|---|---|
| Open | Saunders M Gabrielle | $138,700 | |
| Closed | Weychert M Gabrielle | $170,000 |
Source: Public Records
Tax History
| Year | Tax Paid | Tax Assessment Tax Assessment Total Assessment is a certain percentage of the fair market value that is determined by local assessors to be the total taxable value of land and additions on the property. | Land | Improvement |
|---|---|---|---|---|
| 2025 | $10,317 | $154,470 | $56,130 | $98,340 |
| 2024 | $10,317 | $154,470 | $56,130 | $98,340 |
| 2023 | $10,200 | $154,470 | $56,130 | $98,340 |
| 2022 | $10,025 | $154,470 | $56,130 | $98,340 |
| 2021 | $9,751 | $154,470 | $56,130 | $98,340 |
| 2020 | $9,470 | $154,470 | $56,130 | $98,340 |
| 2019 | $9,281 | $154,470 | $56,130 | $98,340 |
Source: Public Records
Map
Nearby Homes
- 208 Limekiln Pike
- 611 Twickenham Rd
- 523 W Glenside Ave
- 528 526-528 East Ave
- 650 Brooke Rd Unit B11
- 500 W Waverly Rd
- 28 Chelfield Rd
- 359 Lismore Ave
- 118 Egerton Ave
- 121 Elm Ave
- 304 Harrison Ave
- 505 Station Ave
- 140 Harrison Ave
- 765 Limekiln Pike Unit 23
- 221 S Easton Rd
- 910 Edann Rd
- 17 E Waverly Rd
- 1002 Edann Rd
- 21 Red Oak Rd
- 100 Logan Ave
- 507 Lindley Rd
- 511 Lindley Rd
- 505 Lindley Rd
- 513 Lindley Rd
- 317 Winding Way
- 315 Winding Way
- 319 Winding Way
- 508 Lindley Rd
- 506 Lindley Rd
- 313 Winding Way
- 503 Lindley Rd
- 510 Lindley Rd
- 321 Winding Way
- 504 Lindley Rd
- 311 Winding Way
- 502 Lindley Rd
- 533 Georgian Rd
- 323 Winding Way
- 517 Lindley Rd
- 501 Lindley Rd
Your Personal Tour Guide
Ask me questions while you tour the home.