Estimated Value: $294,896
--
Bed
--
Bath
1,637
Sq Ft
$180/Sq Ft
Est. Value
About This Home
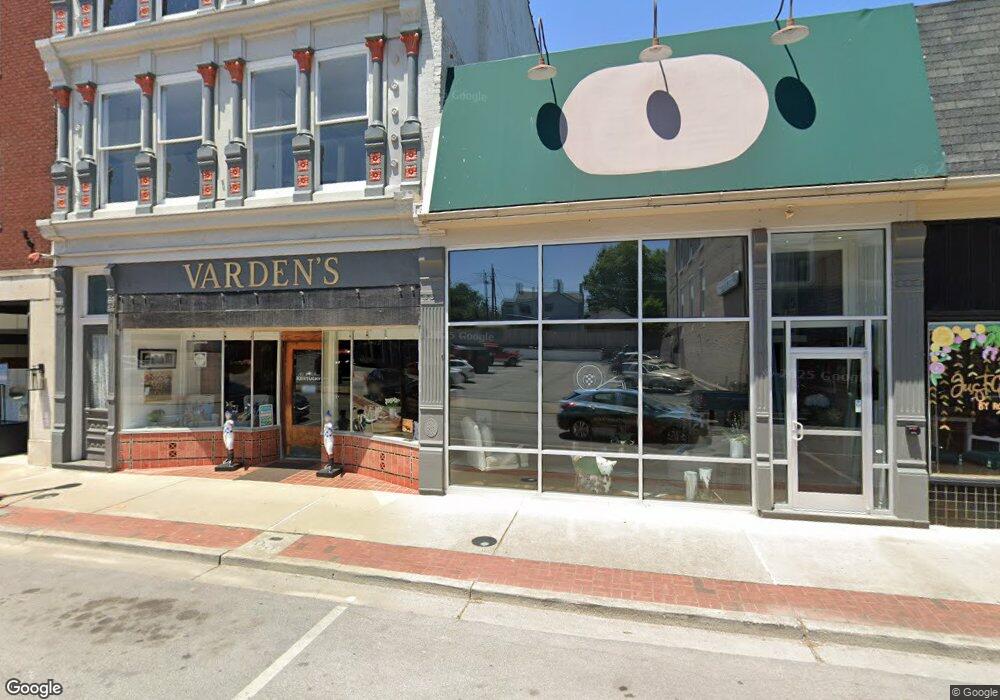
This home is located at 509 Main St, Paris, KY 40361 and is currently estimated at $294,896, approximately $180 per square foot. 509 Main St is a home located in Bourbon County with nearby schools including Paris Elementary School, Paris Middle School, and Paris High School.
Ownership History
Date
Name
Owned For
Owner Type
Purchase Details
Closed on
Mar 6, 2023
Sold by
Tibbs Phillip A and Tibbs Gertrude Anne
Bought by
Vardens Group Llc
Current Estimated Value
Home Financials for this Owner
Home Financials are based on the most recent Mortgage that was taken out on this home.
Original Mortgage
$526,500
Outstanding Balance
$330,371
Interest Rate
6.15%
Mortgage Type
Seller Take Back
Estimated Equity
-$35,475
Purchase Details
Closed on
Nov 18, 2010
Sold by
The Kentucky Trust For Historic Preserva
Bought by
Artcroft Inc
Purchase Details
Closed on
Mar 11, 2006
Sold by
Hansen Jane Collier and Hansen John
Bought by
Tibbs Phillip A and Tibbs Gertrude Anne
Create a Home Valuation Report for This Property
The Home Valuation Report is an in-depth analysis detailing your home's value as well as a comparison with similar homes in the area
Home Values in the Area
Average Home Value in this Area
Purchase History
| Date | Buyer | Sale Price | Title Company |
|---|---|---|---|
| Vardens Group Llc | $585,000 | -- | |
| Vardens Group Llc | $585,000 | None Listed On Document | |
| Artcroft Inc | $5,000 | -- | |
| Tibbs Phillip A | $140,000 | None Available |
Source: Public Records
Mortgage History
| Date | Status | Borrower | Loan Amount |
|---|---|---|---|
| Open | Vardens Group Llc | $526,500 | |
| Closed | Vardens Group Llc | $526,500 |
Source: Public Records
Tax History Compared to Growth
Tax History
| Year | Tax Paid | Tax Assessment Tax Assessment Total Assessment is a certain percentage of the fair market value that is determined by local assessors to be the total taxable value of land and additions on the property. | Land | Improvement |
|---|---|---|---|---|
| 2024 | $1,095 | $319,300 | $20,000 | $299,300 |
| 2023 | $667 | $190,000 | $20,000 | $170,000 |
| 2022 | $680 | $190,000 | $20,000 | $170,000 |
| 2021 | $715 | $190,000 | $20,000 | $170,000 |
| 2020 | $740 | $190,000 | $20,000 | $170,000 |
| 2019 | $775 | $190,000 | $20,000 | $170,000 |
| 2018 | $807 | $190,000 | $20,000 | $170,000 |
| 2017 | $810 | $190,000 | $20,000 | $170,000 |
| 2016 | $813 | $190,000 | $20,000 | $170,000 |
| 2015 | $786 | $190,000 | $20,000 | $170,000 |
| 2014 | $751 | $190,000 | $20,000 | $170,000 |
| 2011 | $751 | $190,000 | $20,000 | $170,000 |
Source: Public Records
Map
Nearby Homes