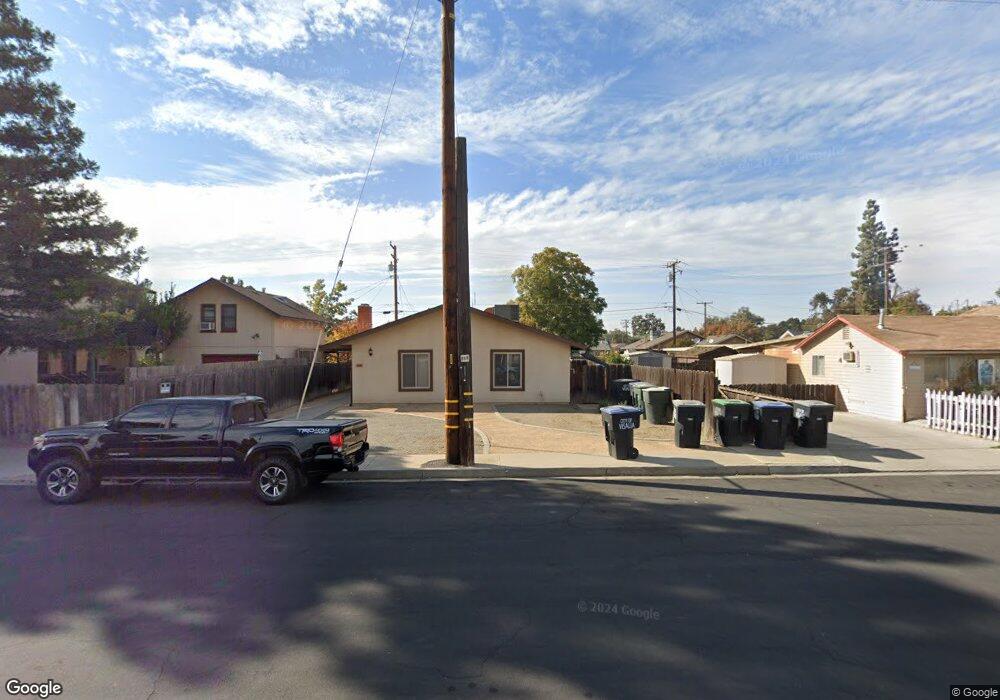
509 S Sowell St Unit A Visalia, CA 93277
South Visalia NeighborhoodEstimated Value: $356,000 - $433,000
4
Beds
3
Baths
2,022
Sq Ft
$200/Sq Ft
Est. Value
About This Home
This home is located at 509 S Sowell St Unit A, Visalia, CA 93277 and is currently estimated at $405,371, approximately $200 per square foot. 509 S Sowell St Unit A is a home located in Tulare County with nearby schools including Divisadero Middle School, Mt. Whitney High School, and Crescent Valley II Public Charter School.
Ownership History
Date
Name
Owned For
Owner Type
Purchase Details
Closed on
Mar 11, 2022
Sold by
Fermin Garza Jr
Bought by
Fermin Garza Jr 2022 Revocable Trust
Current Estimated Value
Purchase Details
Closed on
May 8, 2018
Sold by
Neumann David W and Neumann Janet L
Bought by
Garza Fermin
Home Financials for this Owner
Home Financials are based on the most recent Mortgage that was taken out on this home.
Original Mortgage
$233,689
Interest Rate
5.5%
Mortgage Type
FHA
Purchase Details
Closed on
Dec 12, 2009
Sold by
Neumann David W
Bought by
Neumann Revocable Trust
Purchase Details
Closed on
Aug 14, 1998
Sold by
Gibbs Mildred
Bought by
Neumann David W and Neumann Janet L
Home Financials for this Owner
Home Financials are based on the most recent Mortgage that was taken out on this home.
Original Mortgage
$72,000
Interest Rate
6.92%
Create a Home Valuation Report for This Property
The Home Valuation Report is an in-depth analysis detailing your home's value as well as a comparison with similar homes in the area
Home Values in the Area
Average Home Value in this Area
Purchase History
| Date | Buyer | Sale Price | Title Company |
|---|---|---|---|
| Fermin Garza Jr 2022 Revocable Trust | -- | Schiff Michael J | |
| Garza Fermin | -- | First American Title Co | |
| Neumann David W | -- | First American Title Co | |
| Neumann Revocable Trust | -- | None Available | |
| Neumann David W | $90,000 | First American Title Co |
Source: Public Records
Mortgage History
| Date | Status | Borrower | Loan Amount |
|---|---|---|---|
| Previous Owner | Garza Fermin | $233,689 | |
| Previous Owner | Neumann David W | $72,000 |
Source: Public Records
Tax History Compared to Growth
Tax History
| Year | Tax Paid | Tax Assessment Tax Assessment Total Assessment is a certain percentage of the fair market value that is determined by local assessors to be the total taxable value of land and additions on the property. | Land | Improvement |
|---|---|---|---|---|
| 2025 | $2,864 | $271,937 | $56,890 | $215,047 |
| 2024 | $2,864 | $266,606 | $55,775 | $210,831 |
| 2023 | $2,786 | $261,380 | $54,682 | $206,698 |
| 2022 | $2,662 | $256,256 | $53,610 | $202,646 |
| 2021 | $2,665 | $251,232 | $52,559 | $198,673 |
| 2020 | $2,648 | $248,656 | $52,020 | $196,636 |
| 2019 | $2,569 | $243,780 | $51,000 | $192,780 |
| 2018 | $1,301 | $124,010 | $45,470 | $78,540 |
| 2017 | $1,292 | $121,578 | $44,578 | $77,000 |
| 2016 | $1,263 | $119,194 | $43,704 | $75,490 |
| 2015 | $1,227 | $117,404 | $43,048 | $74,356 |
| 2014 | $1,227 | $115,104 | $42,205 | $72,899 |
Source: Public Records
Map
Nearby Homes
- 602 S Conyer St
- 1301 W Beverly Dr
- 1107 W Westcott Ave
- 526 W Myrtle Ave
- 621 S Divisadero St
- 1321 W Oak Ave
- 1421 W Oak Ave
- 313 N Giddings St
- 1315 S Conyer St
- 433 S Church St
- 733 W Paradise Ave
- 542 W Paradise Ave
- 1406 W Princeton Ave
- 704 N Divisadero St
- 1640 W Princeton Ct
- 422 W Race Ave
- 1608 S Central St
- 714 W Cambridge Ave
- 439 S Bridge St Unit 5
- 1518 W Grove Ave
- 1106 W Kaweah Ave
- 1101 W Noble Ave
- 1105 W Noble Ave
- 1100 W Kaweah Ave Unit 1
- 1100 W Kaweah Ave
- 1108 W Kaweah Ave
- 502 S Oak Park St
- 1020 W Kaweah Ave
- 500 S Oak Park St
- 1019 W Noble Ave
- 520 S Oak Park St
- 1016 W Kaweah Ave
- 1101 W Kaweah Ave
- 1013 W Noble Ave
- 1107 W Kaweah Ave
- 607 S Sowell St
- 1009 W Noble Ave
- 0 W Kaweah Ave
- 600 S Oak Park St
- 1011 W Kaweah Ave