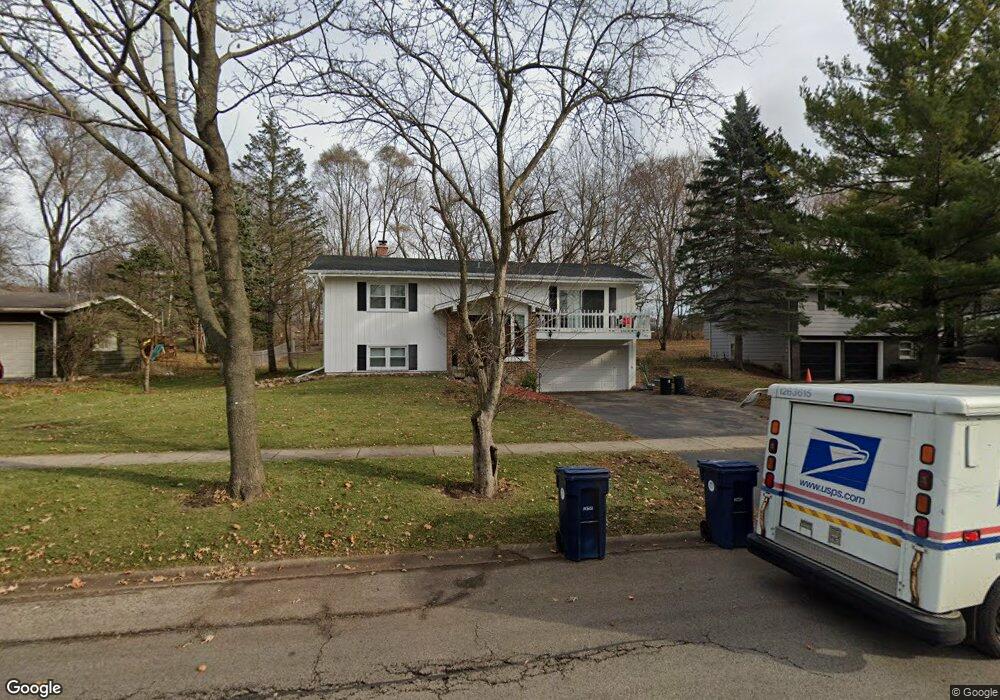
509 Scott St Algonquin, IL 60102
Estimated Value: $354,051 - $449,000
4
Beds
2
Baths
2,430
Sq Ft
$164/Sq Ft
Est. Value
About This Home
This home is located at 509 Scott St, Algonquin, IL 60102 and is currently estimated at $398,013, approximately $163 per square foot. 509 Scott St is a home located in McHenry County with nearby schools including Eastview Elementary School, Algonquin Middle School, and Dundee-Crown High School.
Ownership History
Date
Name
Owned For
Owner Type
Purchase Details
Closed on
Jan 28, 2016
Sold by
Evans Marybeth
Bought by
Kelly Joseph N and Kelly Sherry L
Current Estimated Value
Home Financials for this Owner
Home Financials are based on the most recent Mortgage that was taken out on this home.
Original Mortgage
$172,812
Outstanding Balance
$139,088
Interest Rate
4.25%
Mortgage Type
FHA
Estimated Equity
$258,925
Purchase Details
Closed on
Aug 19, 2013
Sold by
Evans Richard L
Bought by
Evans Marybeth
Purchase Details
Closed on
Jun 7, 2012
Sold by
Evans Richard and Evans Marybeth
Bought by
Kelly Joe and Kelly Sherry
Create a Home Valuation Report for This Property
The Home Valuation Report is an in-depth analysis detailing your home's value as well as a comparison with similar homes in the area
Purchase History
| Date | Buyer | Sale Price | Title Company |
|---|---|---|---|
| Kelly Joseph N | $183,400 | First American Title | |
| Evans Marybeth | -- | None Available | |
| Kelly Joe | -- | None Available |
Source: Public Records
Mortgage History
| Date | Status | Borrower | Loan Amount |
|---|---|---|---|
| Open | Kelly Joseph N | $172,812 |
Source: Public Records
Tax History
| Year | Tax Paid | Tax Assessment Tax Assessment Total Assessment is a certain percentage of the fair market value that is determined by local assessors to be the total taxable value of land and additions on the property. | Land | Improvement |
|---|---|---|---|---|
| 2024 | $6,496 | $91,045 | $13,681 | $77,364 |
| 2023 | $6,147 | $81,428 | $12,236 | $69,192 |
| 2022 | $6,060 | $76,661 | $16,863 | $59,798 |
| 2021 | $5,805 | $71,419 | $15,710 | $55,709 |
| 2020 | $5,647 | $68,891 | $15,154 | $53,737 |
| 2019 | $5,504 | $65,937 | $14,504 | $51,433 |
| 2018 | $5,234 | $60,912 | $13,399 | $47,513 |
| 2017 | $5,117 | $57,383 | $12,623 | $44,760 |
| 2016 | $5,029 | $53,820 | $11,839 | $41,981 |
| 2013 | -- | $56,510 | $11,044 | $45,466 |
Source: Public Records
Map
Nearby Homes
- 719 Webster St
- 600 E Algonquin Rd
- 407 La Fox River Dr
- 21 Division St
- 0 Natoma Trail
- 0 River Dr N Unit MRD12473279
- lot 25 Wabican Trail
- 1188 E Algonquin Rd
- 953 Old Oak Cir
- Lot #3-5 Hayes Rd
- 1200 Hillside View
- 1420 Greenridge Ave
- 1031 Timberwood Ln
- Lot 4 b Ryan Pkwy
- 1770 E Algonquin Rd
- 615 Harper Dr
- 308 Rustic Ln
- 730 Chestnut Ct
- 1730 Tanglewood Dr
- 1782 Cumberland Pkwy
Your Personal Tour Guide
Ask me questions while you tour the home.