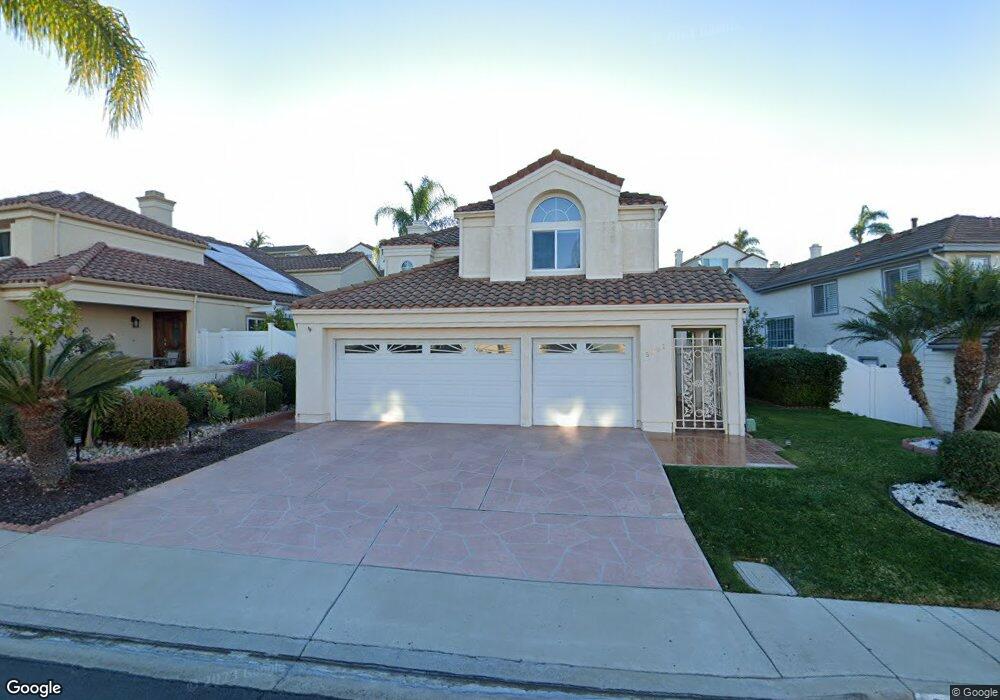
5091 Via Playa Los Santos San Diego, CA 92124
Tierrasanta NeighborhoodEstimated Value: $1,454,000 - $1,511,872
4
Beds
3
Baths
2,469
Sq Ft
$600/Sq Ft
Est. Value
About This Home
This home is located at 5091 Via Playa Los Santos, San Diego, CA 92124 and is currently estimated at $1,480,718, approximately $599 per square foot. 5091 Via Playa Los Santos is a home located in San Diego County with nearby schools including Kumeyaay Elementary School, De Portola Middle School, and Farb Middle School.
Ownership History
Date
Name
Owned For
Owner Type
Purchase Details
Closed on
Jun 7, 2024
Sold by
Zheng-Castruita Cristina and Cristina Zheng Living Trust
Bought by
Castruita Robert
Current Estimated Value
Purchase Details
Closed on
Mar 20, 2024
Sold by
Robert Castruita and Robert Cristina Zheng-Cast
Bought by
Castruita Revocable Trust and Castruita
Purchase Details
Closed on
Sep 2, 2019
Sold by
Castruita Robert and Zheng Castruita Cristina
Bought by
Castruita Robert and Zheng Castruita Cristina
Home Financials for this Owner
Home Financials are based on the most recent Mortgage that was taken out on this home.
Original Mortgage
$625,000
Interest Rate
3.7%
Mortgage Type
New Conventional
Purchase Details
Closed on
Aug 22, 2019
Sold by
Castruita Robert and Zheng Castruita Cristina
Bought by
Castruita Robert and Zheng Castruita Cristina
Home Financials for this Owner
Home Financials are based on the most recent Mortgage that was taken out on this home.
Original Mortgage
$625,000
Interest Rate
3.7%
Mortgage Type
New Conventional
Purchase Details
Closed on
Jan 23, 2018
Sold by
Castruita Robert and Zheng Castruita Crintina
Bought by
Castruita Robert and Zheng Castruita Cristina
Purchase Details
Closed on
Apr 26, 2017
Sold by
Kron Elena Kron An
Bought by
Castruita Robert and Zheng Castruita Cristina
Home Financials for this Owner
Home Financials are based on the most recent Mortgage that was taken out on this home.
Original Mortgage
$650,000
Interest Rate
4.23%
Mortgage Type
New Conventional
Purchase Details
Closed on
Feb 14, 2011
Sold by
Kron Elena
Bought by
Kron Elena
Purchase Details
Closed on
May 9, 2008
Sold by
Kron Elena
Bought by
Kron Elena
Home Financials for this Owner
Home Financials are based on the most recent Mortgage that was taken out on this home.
Original Mortgage
$172,500
Interest Rate
5.88%
Mortgage Type
Stand Alone Refi Refinance Of Original Loan
Purchase Details
Closed on
Nov 10, 2003
Sold by
Kron Elena
Bought by
Kron Elena
Purchase Details
Closed on
May 6, 1998
Sold by
Rabinovich and Polya
Bought by
Kron Elena
Home Financials for this Owner
Home Financials are based on the most recent Mortgage that was taken out on this home.
Original Mortgage
$186,000
Interest Rate
7.05%
Purchase Details
Closed on
Feb 19, 1998
Sold by
Rabinovich and Polya
Bought by
Rabinovich Abram and Rabinovich Polya
Purchase Details
Closed on
Dec 20, 1991
Create a Home Valuation Report for This Property
The Home Valuation Report is an in-depth analysis detailing your home's value as well as a comparison with similar homes in the area
Home Values in the Area
Average Home Value in this Area
Purchase History
| Date | Buyer | Sale Price | Title Company |
|---|---|---|---|
| Castruita Robert | -- | None Listed On Document | |
| Castruita Revocable Trust | -- | None Listed On Document | |
| Castruita Robert | -- | Chicago Title | |
| Castruita Robert | -- | Chicago Title | |
| Castruita Robert | -- | None Available | |
| Castruita Robert | $765,000 | Chicago Title Company | |
| Kron Elena | -- | None Available | |
| Kron Elena | -- | First American Title Company | |
| Kron Elena | -- | First American Title Company | |
| Kron Elena | -- | -- | |
| Kron Elena | -- | Gateway Title Company | |
| Rabinovich Abram | -- | -- | |
| -- | $257,000 | -- |
Source: Public Records
Mortgage History
| Date | Status | Borrower | Loan Amount |
|---|---|---|---|
| Previous Owner | Castruita Robert | $625,000 | |
| Previous Owner | Castruita Robert | $650,000 | |
| Previous Owner | Kron Elena | $172,500 | |
| Previous Owner | Kron Elena | $186,000 |
Source: Public Records
Tax History Compared to Growth
Tax History
| Year | Tax Paid | Tax Assessment Tax Assessment Total Assessment is a certain percentage of the fair market value that is determined by local assessors to be the total taxable value of land and additions on the property. | Land | Improvement |
|---|---|---|---|---|
| 2025 | $10,739 | $887,839 | $241,811 | $646,028 |
| 2024 | $10,739 | $870,431 | $237,070 | $633,361 |
| 2023 | $10,498 | $853,365 | $232,422 | $620,943 |
| 2022 | $10,214 | $836,633 | $227,865 | $608,768 |
| 2021 | $10,137 | $820,230 | $223,398 | $596,832 |
| 2020 | $10,013 | $811,821 | $221,108 | $590,713 |
| 2019 | $9,833 | $795,904 | $216,773 | $579,131 |
| 2018 | $9,194 | $780,299 | $212,523 | $567,776 |
| 2017 | $81 | $391,569 | $106,648 | $284,921 |
| 2016 | $4,530 | $383,892 | $104,557 | $279,335 |
| 2015 | $4,462 | $378,127 | $102,987 | $275,140 |
| 2014 | $4,391 | $370,721 | $100,970 | $269,751 |
Source: Public Records
Map
Nearby Homes
- 11370 Camino Playa Cancun Unit 3
- 11176 Portobelo Dr
- 4755 Mayita Way
- 11136 Portobelo Dr
- 11048 Portobelo Dr
- 11056 Portobelo Dr
- 11080 Portobelo Dr
- 11086 Portobelo Dr Unit 125
- 5238 Camino Playa Malaga
- 4989 Corte Playa Encino
- 10908 Avenida Playa Veracruz
- 4375 Calle de Vida
- 6161 Calle Mariselda Unit 408
- 10945 Clairemont Mesa Blvd
- 10834 Caravelle Place
- 10828 Lamentin Ct Unit 313
- 10889 Lamentin Ct
- 10812 Lamentin Ct Unit 312
- 6140 Calle Mariselda Unit 102
- 11037 Pallon Way
- 5101 Via Playa Los Santos
- 5083 Via Playa Los Santos
- 5113 Via Playa Los Santos Unit 3
- 5071 Via Playa Los Santos
- 5078 Corte Playa Catalina
- 5088 Corte Playa Catalina
- 5063 Via Playa Los Santos Unit 3
- 5125 Via Playa Los Santos
- 5070 Corte Playa Catalina
- 5096 Corte Playa Catalina
- 5102 Corte Playa Catalina Unit 3
- 5060 Corte Playa Catalina
- 5051 Via Playa Los Santos
- 5137 Via Playa Los Santos
- 5084 Via Playa Los Santos
- 5092 Via Playa Los Santos
- 5072 Via Playa Los Santos
- 5110 Corte Playa Catalina
- 5064 Via Playa Los Santos
- 5052 Corte Playa Catalina