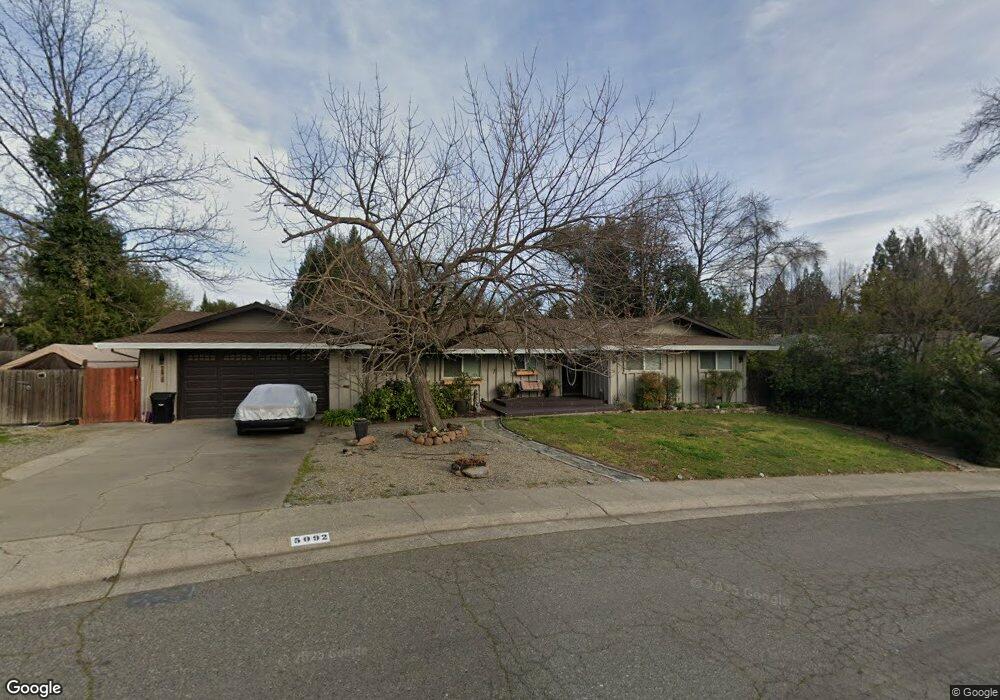
5092 Cocoa Palm Way Fair Oaks, CA 95628
Estimated Value: $403,000 - $647,000
3
Beds
2
Baths
1,622
Sq Ft
$342/Sq Ft
Est. Value
About This Home
This home is located at 5092 Cocoa Palm Way, Fair Oaks, CA 95628 and is currently estimated at $554,210, approximately $341 per square foot. 5092 Cocoa Palm Way is a home located in Sacramento County with nearby schools including Northridge Elementary School, Andrew Carnegie Middle School, and Bella Vista High School.
Ownership History
Date
Name
Owned For
Owner Type
Purchase Details
Closed on
Jul 18, 1995
Sold by
Hirt Charles Jospeh and Hirt Janice Evelyn
Bought by
Dermenjian Sean C and Dermenjian Lisa M
Current Estimated Value
Home Financials for this Owner
Home Financials are based on the most recent Mortgage that was taken out on this home.
Original Mortgage
$155,215
Interest Rate
7.59%
Mortgage Type
FHA
Create a Home Valuation Report for This Property
The Home Valuation Report is an in-depth analysis detailing your home's value as well as a comparison with similar homes in the area
Home Values in the Area
Average Home Value in this Area
Purchase History
| Date | Buyer | Sale Price | Title Company |
|---|---|---|---|
| Dermenjian Sean C | $167,000 | North American Title Ins Co |
Source: Public Records
Mortgage History
| Date | Status | Borrower | Loan Amount |
|---|---|---|---|
| Closed | Dermenjian Sean C | $155,215 |
Source: Public Records
Tax History Compared to Growth
Tax History
| Year | Tax Paid | Tax Assessment Tax Assessment Total Assessment is a certain percentage of the fair market value that is determined by local assessors to be the total taxable value of land and additions on the property. | Land | Improvement |
|---|---|---|---|---|
| 2025 | $3,291 | $277,400 | $138,201 | $139,199 |
| 2024 | $3,291 | $271,962 | $135,492 | $136,470 |
| 2023 | $3,194 | $266,631 | $132,836 | $133,795 |
| 2022 | $3,180 | $261,404 | $130,232 | $131,172 |
| 2021 | $3,117 | $256,279 | $127,679 | $128,600 |
| 2020 | $3,071 | $253,652 | $126,370 | $127,282 |
| 2019 | $2,992 | $248,680 | $123,893 | $124,787 |
| 2018 | $2,925 | $243,805 | $121,464 | $122,341 |
| 2017 | $2,894 | $239,026 | $119,083 | $119,943 |
| 2016 | $2,703 | $234,341 | $116,749 | $117,592 |
| 2015 | $3,196 | $230,822 | $114,996 | $115,826 |
| 2014 | $2,598 | $226,302 | $112,744 | $113,558 |
Source: Public Records
Map
Nearby Homes
- 5101 Cocoa Palm Way
- 5020 Cozzins Ct
- 5137 Kauai Way
- 11330 Fair Oaks Blvd
- 11330 Fair Oaks Blvd Unit 102A
- 5343 Maui Way
- 8072 Dorian Way
- 4924 Buena Vista Ave
- 5001 Shamrock Dr
- 7948- Sunset Ave
- 8366 Madison Ave
- 8063 Youngheart Ln
- 8028 Vintage Way
- 8140 Maderia Port Ln
- 8075 Vintage Way
- 8076 Vintage Way
- 4900 Rimwood Dr
- 8464 Sunset Ave
- 8200 Shangrila Dr
- 8065 Livorna Way
- 5096 Cocoa Palm Way
- 5088 Cocoa Palm Way
- 5031 Blanchard Ct
- 8235 Bramhall Way
- 5027 Blanchard Ct
- 5100 Cocoa Palm Way
- 5033 Blanchard Ct
- 5084 Cocoa Palm Way
- 8241 Bramhall Way
- 5083 Cocoa Palm Way
- 5026 Blanchard Ct
- 5018 Shadowood Way
- 8208 Kaula Dr
- 8216 Kaula Dr
- 8204 Kaula Dr
- 8218 Kaula Dr
- 8226 Bramhall Way
- 8180 Woodleaf Dr
- 8234 Bramhall Way
- 8245 Bramhall Way