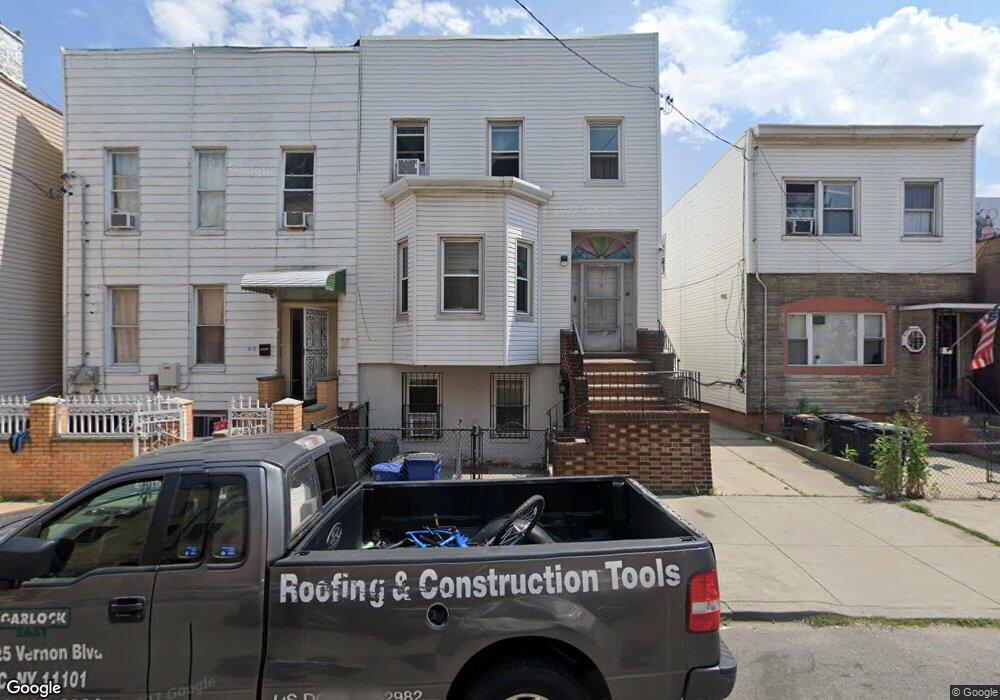
51-19 34th St Long Island City, NY 11101
Blissville NeighborhoodEstimated Value: $1,193,955 - $1,632,000
--
Bed
3
Baths
2,712
Sq Ft
$546/Sq Ft
Est. Value
About This Home
This home is located at 51-19 34th St, Long Island City, NY 11101 and is currently estimated at $1,480,489, approximately $545 per square foot. 51-19 34th St is a home located in Queens County with nearby schools including P.S. 199 Maurice A Fitzgerald, Long Island City High School, and Toobaa Academy.
Ownership History
Date
Name
Owned For
Owner Type
Purchase Details
Closed on
Apr 15, 2016
Sold by
Cash Kathleen L and Cash Sean M
Bought by
Nicaj Gjelosh and Nicaj Maria
Current Estimated Value
Purchase Details
Closed on
Aug 31, 2012
Sold by
Patti Marilyn and Sobieski Marilyn
Bought by
Cash Kathleen L and Cash Sean M
Home Financials for this Owner
Home Financials are based on the most recent Mortgage that was taken out on this home.
Original Mortgage
$325,000
Interest Rate
3.59%
Mortgage Type
New Conventional
Purchase Details
Closed on
Oct 11, 2000
Sold by
Sobieski Marilyn and Goralski Joanne
Bought by
Sobieski Marilyn
Home Financials for this Owner
Home Financials are based on the most recent Mortgage that was taken out on this home.
Original Mortgage
$25,000
Interest Rate
7.83%
Purchase Details
Closed on
Dec 5, 1997
Sold by
Sobieski Marilyn and Petrovich Agnes
Bought by
Sobieski Marilyn and Goralski Joanne
Create a Home Valuation Report for This Property
The Home Valuation Report is an in-depth analysis detailing your home's value as well as a comparison with similar homes in the area
Home Values in the Area
Average Home Value in this Area
Purchase History
| Date | Buyer | Sale Price | Title Company |
|---|---|---|---|
| Nicaj Gjelosh | $870,000 | -- | |
| Nicaj Gjelosh | $870,000 | -- | |
| Cash Kathleen L | $475,000 | -- | |
| Cash Kathleen L | $475,000 | -- | |
| Sobieski Marilyn | $22,000 | First American Title Ins Co | |
| Sobieski Marilyn | -- | First American Title Ins Co | |
| Sobieski Marilyn | -- | Chicago Title Insurance Co | |
| Sobieski Marilyn | -- | Chicago Title Insurance Co |
Source: Public Records
Mortgage History
| Date | Status | Borrower | Loan Amount |
|---|---|---|---|
| Open | Nicaj Gjelosh | $450,000 | |
| Previous Owner | Cash Kathleen L | $325,000 | |
| Previous Owner | Sobieski Marilyn | $25,000 |
Source: Public Records
Tax History Compared to Growth
Tax History
| Year | Tax Paid | Tax Assessment Tax Assessment Total Assessment is a certain percentage of the fair market value that is determined by local assessors to be the total taxable value of land and additions on the property. | Land | Improvement |
|---|---|---|---|---|
| 2025 | $5,699 | $30,025 | $4,751 | $25,274 |
| 2024 | $5,699 | $28,373 | $4,223 | $24,150 |
| 2023 | $5,440 | $27,086 | $3,828 | $23,258 |
| 2022 | $5,149 | $89,460 | $15,180 | $74,280 |
| 2021 | $5,429 | $84,420 | $15,180 | $69,240 |
| 2020 | $5,296 | $76,320 | $15,180 | $61,140 |
| 2019 | $4,946 | $78,180 | $15,180 | $63,000 |
| 2018 | $4,601 | $22,572 | $5,973 | $16,599 |
| 2017 | $4,382 | $21,496 | $6,230 | $15,266 |
| 2016 | $4,297 | $21,496 | $6,230 | $15,266 |
| 2015 | $2,226 | $20,851 | $6,457 | $14,394 |
| 2014 | $2,226 | $19,704 | $7,037 | $12,667 |
Source: Public Records
Map
Nearby Homes
- 5117 34th St
- 5130 35th St
- 31-34 Greenpoint Ave
- 50 Greenpoint Ave Unit 6H
- 50 Greenpoint Ave Unit 3D
- 50-35 38th St
- 50-43 39th St
- 50-15 39th St Unit 1F
- 50-15 39th St Unit 1C
- 50-15 39th St Unit 1G
- 5054 39th Place
- 50-21 39th Place Unit 5H
- 50-21 39th Place Unit 2C
- 3809 48th Ave
- 0 39th St
- 50-22 40th St Unit 2F
- 50-22 40th St Unit 6C
- 48- 17 39th Place Unit 1
- 50-17 40th St
- 4827 40th St
- 5119 34th St
- 51-19 34 Th St Unit 1
- 5119 34th St Unit 1
- 5119 34th St
- 5121 34th St Unit 1st.Fl
- 5121 34th St Unit 2nd Fl
- 5121 34th St Unit 1st.Fl
- 5121 34th St Unit 2nd Fl
- 5121 34th St
- 51-15 34th St
- 5115 34th St
- 5123 34th St
- 5111 34th St
- 5103 Van Dam St
- 5136 35th St
- 51-07 34th St Unit 3
- 5142 35th St
- 51-07 34 Th St Unit 3
- 5107 34th St
- 5140 35th St