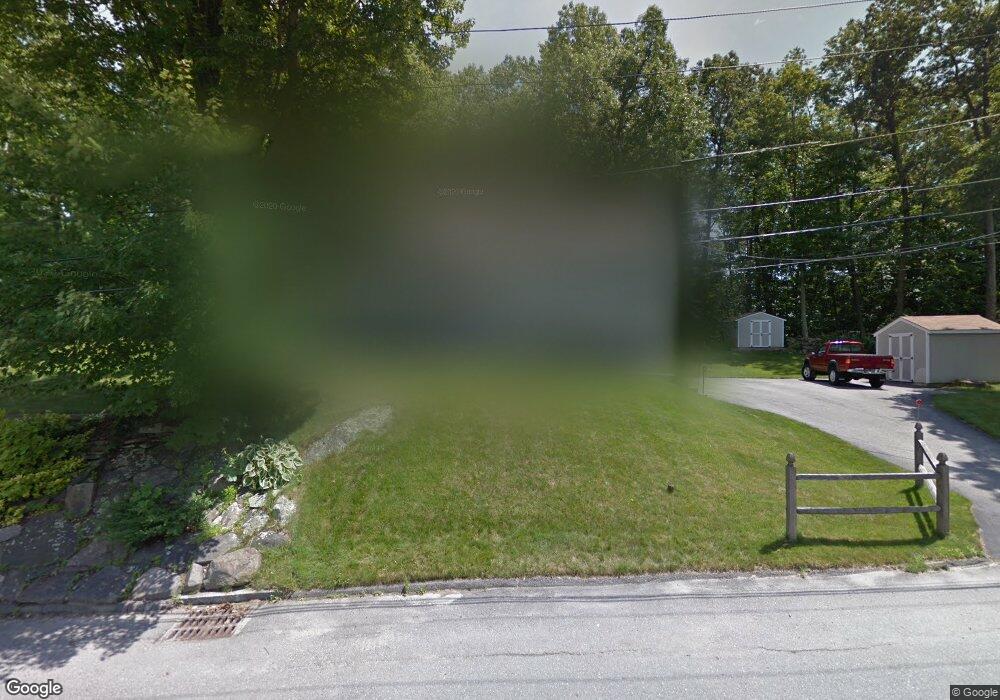
51 1st St Worcester, MA 01602
Webster Square NeighborhoodEstimated Value: $391,000 - $429,979
2
Beds
1
Bath
1,044
Sq Ft
$393/Sq Ft
Est. Value
About This Home
This home is located at 51 1st St, Worcester, MA 01602 and is currently estimated at $409,995, approximately $392 per square foot. 51 1st St is a home located in Worcester County with nearby schools including Tatnuck Magnet School, Chandler Magnet, and Jacob Hiatt Magnet School.
Ownership History
Date
Name
Owned For
Owner Type
Purchase Details
Closed on
Nov 9, 2022
Sold by
Minka Theodore A and Minka Diana R
Bought by
T & S M Ft
Current Estimated Value
Create a Home Valuation Report for This Property
The Home Valuation Report is an in-depth analysis detailing your home's value as well as a comparison with similar homes in the area
Home Values in the Area
Average Home Value in this Area
Purchase History
| Date | Buyer | Sale Price | Title Company |
|---|---|---|---|
| T & S M Ft | -- | None Available |
Source: Public Records
Tax History Compared to Growth
Tax History
| Year | Tax Paid | Tax Assessment Tax Assessment Total Assessment is a certain percentage of the fair market value that is determined by local assessors to be the total taxable value of land and additions on the property. | Land | Improvement |
|---|---|---|---|---|
| 2025 | $4,971 | $376,900 | $99,500 | $277,400 |
| 2024 | $4,916 | $357,500 | $99,500 | $258,000 |
| 2023 | $4,804 | $335,000 | $86,600 | $248,400 |
| 2022 | $4,163 | $273,700 | $69,300 | $204,400 |
| 2021 | $4,106 | $252,200 | $55,500 | $196,700 |
| 2020 | $3,903 | $229,600 | $55,000 | $174,600 |
| 2019 | $3,791 | $210,600 | $48,400 | $162,200 |
| 2018 | $3,801 | $201,000 | $48,400 | $152,600 |
| 2017 | $3,635 | $189,100 | $48,400 | $140,700 |
| 2016 | $3,615 | $175,400 | $35,800 | $139,600 |
| 2015 | $3,520 | $175,400 | $35,800 | $139,600 |
| 2014 | $3,427 | $175,400 | $35,800 | $139,600 |
Source: Public Records
Map
Nearby Homes