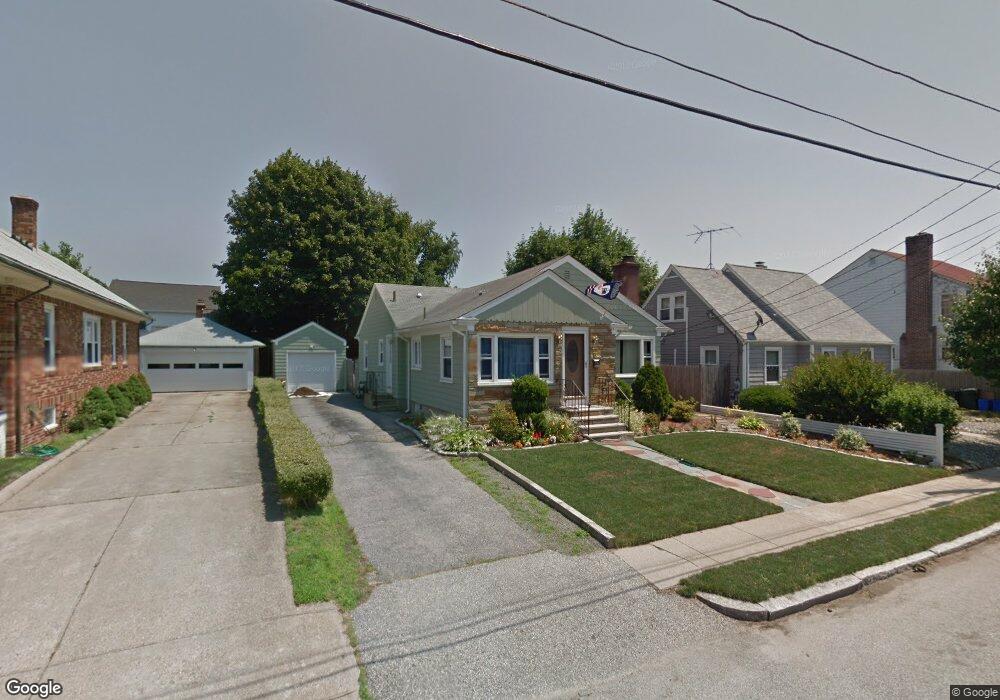
51 Ausdale Rd Cranston, RI 02910
Forest Hills NeighborhoodEstimated Value: $400,000 - $418,000
3
Beds
2
Baths
1,825
Sq Ft
$224/Sq Ft
Est. Value
About This Home
This home is located at 51 Ausdale Rd, Cranston, RI 02910 and is currently estimated at $409,082, approximately $224 per square foot. 51 Ausdale Rd is a home located in Providence County with nearby schools including Woodridge Elementary School, Western Hills Middle School, and Cranston High School West.
Ownership History
Date
Name
Owned For
Owner Type
Purchase Details
Closed on
Jan 28, 2009
Sold by
Household Finance Corp
Bought by
Furtado Steven M and Stabile Jennifer
Current Estimated Value
Home Financials for this Owner
Home Financials are based on the most recent Mortgage that was taken out on this home.
Original Mortgage
$165,318
Outstanding Balance
$105,503
Interest Rate
5.28%
Mortgage Type
Purchase Money Mortgage
Estimated Equity
$303,579
Purchase Details
Closed on
Nov 18, 2008
Sold by
Greco Nancy and Greco Steven
Bought by
Household Finance Corp
Purchase Details
Closed on
Aug 27, 2003
Sold by
Darezzo Phillip and Darezzo Carol
Bought by
Greco Steven and Greco Nancy
Purchase Details
Closed on
Jun 12, 1995
Sold by
Mastrobuono Nicholas K and Mastrobuono Adeline
Bought by
Darezzo Phillip B and Darezzo Carol
Create a Home Valuation Report for This Property
The Home Valuation Report is an in-depth analysis detailing your home's value as well as a comparison with similar homes in the area
Home Values in the Area
Average Home Value in this Area
Purchase History
| Date | Buyer | Sale Price | Title Company |
|---|---|---|---|
| Furtado Steven M | $167,000 | -- | |
| Household Finance Corp | $154,500 | -- | |
| Greco Steven | $196,000 | -- | |
| Darezzo Phillip B | $111,000 | -- |
Source: Public Records
Mortgage History
| Date | Status | Borrower | Loan Amount |
|---|---|---|---|
| Open | Darezzo Phillip B | $165,318 | |
| Previous Owner | Darezzo Phillip B | $240,000 | |
| Previous Owner | Darezzo Phillip B | $25,684 |
Source: Public Records
Tax History Compared to Growth
Tax History
| Year | Tax Paid | Tax Assessment Tax Assessment Total Assessment is a certain percentage of the fair market value that is determined by local assessors to be the total taxable value of land and additions on the property. | Land | Improvement |
|---|---|---|---|---|
| 2025 | $4,554 | $328,100 | $102,000 | $226,100 |
| 2024 | $4,465 | $328,100 | $102,000 | $226,100 |
| 2023 | $4,317 | $228,400 | $70,400 | $158,000 |
| 2022 | $4,228 | $228,400 | $70,400 | $158,000 |
| 2021 | $4,111 | $228,400 | $70,400 | $158,000 |
| 2020 | $4,046 | $194,800 | $73,700 | $121,100 |
| 2019 | $4,046 | $194,800 | $73,700 | $121,100 |
| 2018 | $3,952 | $194,800 | $73,700 | $121,100 |
| 2017 | $4,065 | $177,200 | $67,000 | $110,200 |
| 2016 | $3,978 | $177,200 | $67,000 | $110,200 |
| 2015 | $3,978 | $177,200 | $67,000 | $110,200 |
| 2014 | $3,894 | $170,500 | $67,000 | $103,500 |
Source: Public Records
Map
Nearby Homes
- 12 Stevens Rd
- 55 Columbus Blvd
- 46 Roslyn Ave
- 140 Concord Ave
- 130 Wollaston St
- 115 Norfolk St
- 74 Leslie St
- 51 Norfolk St
- 63 Packard St
- 80 Packard St
- 36 Blackamore Ave
- 75 High School Ave
- 111 Belgium St
- 210 Crescent Ave
- 140 Eldridge St
- 1 Rolfe Square
- 166 Midwood St
- 0 Fiat Ave
- 136 Frankfort St
- 41 Gleason St