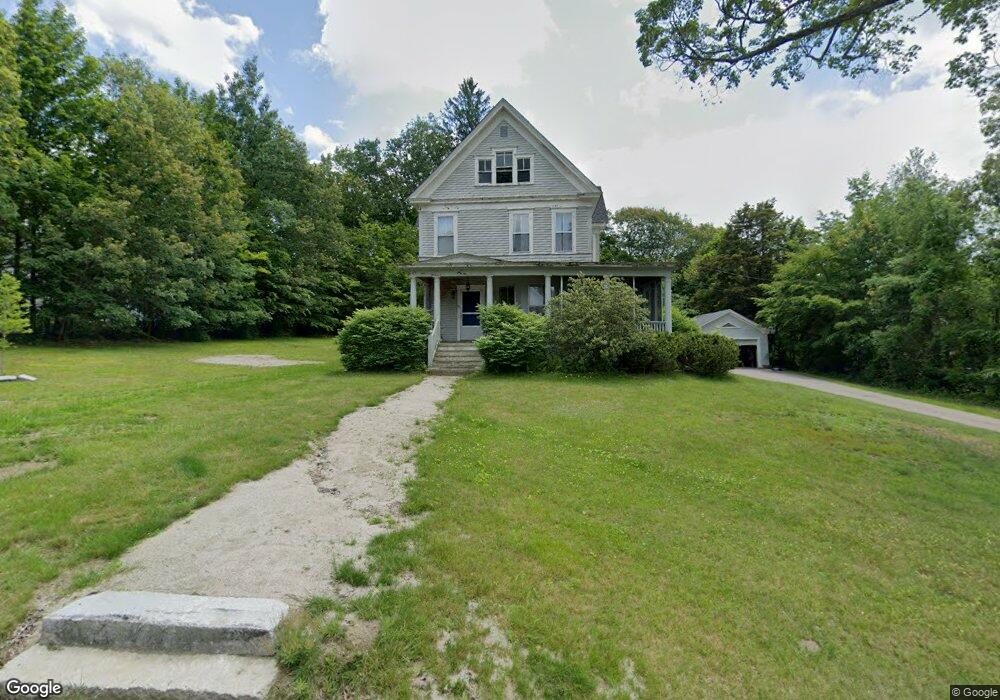
51 Beech St Franklin, NH 03235
Estimated Value: $396,000 - $445,000
5
Beds
3
Baths
2,838
Sq Ft
$150/Sq Ft
Est. Value
About This Home
This home is located at 51 Beech St, Franklin, NH 03235 and is currently estimated at $424,926, approximately $149 per square foot. 51 Beech St is a home located in Merrimack County with nearby schools including Paul A. Smith School, Franklin Middle School, and Franklin High School.
Ownership History
Date
Name
Owned For
Owner Type
Purchase Details
Closed on
Apr 6, 2022
Sold by
Parichand Robert G
Bought by
Parichand Martin
Current Estimated Value
Home Financials for this Owner
Home Financials are based on the most recent Mortgage that was taken out on this home.
Original Mortgage
$155,000
Outstanding Balance
$145,288
Interest Rate
4.67%
Mortgage Type
Stand Alone Refi Refinance Of Original Loan
Estimated Equity
$279,638
Purchase Details
Closed on
Jan 28, 2019
Sold by
Franklin City Of
Bought by
Parichand Martin and Parichand Robert G
Purchase Details
Closed on
Sep 19, 2005
Sold by
Thomas G Gill T
Bought by
Ferro Vincent A
Create a Home Valuation Report for This Property
The Home Valuation Report is an in-depth analysis detailing your home's value as well as a comparison with similar homes in the area
Home Values in the Area
Average Home Value in this Area
Purchase History
| Date | Buyer | Sale Price | Title Company |
|---|---|---|---|
| Parichand Martin | -- | None Available | |
| Parichand Martin | -- | None Available | |
| Parichand Martin | $35,000 | -- | |
| Ferro Vincent A | $289,000 | -- | |
| Ferro Vincent A | $289,000 | -- |
Source: Public Records
Mortgage History
| Date | Status | Borrower | Loan Amount |
|---|---|---|---|
| Open | Parichand Martin | $155,000 | |
| Closed | Parichand Martin | $155,000 | |
| Previous Owner | Ferro Vincent A | $100,000 | |
| Previous Owner | Ferro Vincent A | $70,000 |
Source: Public Records
Tax History
| Year | Tax Paid | Tax Assessment Tax Assessment Total Assessment is a certain percentage of the fair market value that is determined by local assessors to be the total taxable value of land and additions on the property. | Land | Improvement |
|---|---|---|---|---|
| 2025 | $6,532 | $370,500 | $78,400 | $292,100 |
| 2024 | $6,028 | $351,500 | $78,400 | $273,100 |
| 2023 | $5,715 | $351,500 | $78,400 | $273,100 |
| 2022 | $4,980 | $204,200 | $64,500 | $139,700 |
| 2021 | $4,586 | $197,600 | $64,500 | $133,100 |
| 2020 | $4,513 | $197,600 | $64,500 | $133,100 |
| 2019 | $4,339 | $193,100 | $64,500 | $128,600 |
| 2018 | $4,331 | $197,200 | $64,500 | $132,700 |
| 2017 | $4,580 | $179,200 | $40,900 | $138,300 |
| 2016 | $4,519 | $179,100 | $40,900 | $138,200 |
| 2015 | $3,477 | $139,370 | $28,630 | $110,740 |
| 2011 | $5,018 | $233,200 | $47,200 | $186,000 |
Source: Public Records
Map
Nearby Homes
- 18 Highland Ave
- 88 Franklin St
- 5 Evans Ct
- 29 Elkins St
- 416 Central St
- 24 Munroe St Unit 1&2
- 40 Millstone Dr Unit 60
- 0 Rowell Dr Unit 406 5043422
- 48 Millstone Dr Unit 58
- 50 Millstone Dr Unit 57
- 69 Cheney St
- 12 Village Way Unit 38
- 22 Stonehenge Cir Unit 7
- 11 Stonehenge Cir Unit 2
- 15 Millstone Dr Unit 15
- 41 Village Way Unit 22
- 9 Stonehenge Cir Unit 1
- Lot 4 Piper St
- 225 Kendall St
- lot 24 Route 11
Your Personal Tour Guide
Ask me questions while you tour the home.