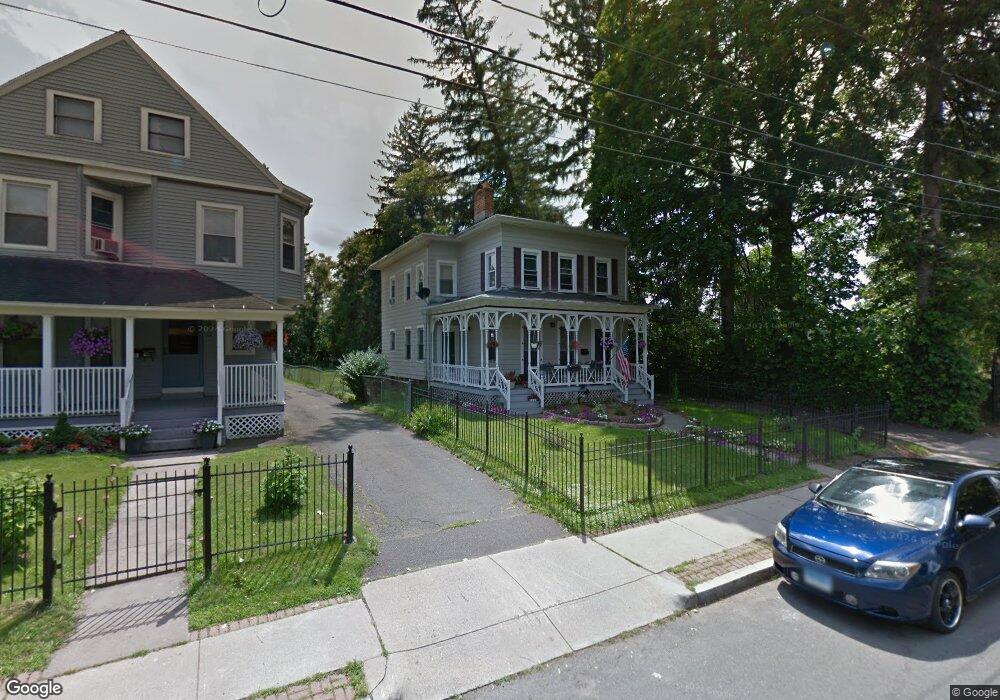
51 Capen St Hartford, CT 06120
North End NeighborhoodEstimated Value: $183,000 - $290,000
4
Beds
2
Baths
2,058
Sq Ft
$111/Sq Ft
Est. Value
About This Home
This home is located at 51 Capen St, Hartford, CT 06120 and is currently estimated at $228,323, approximately $110 per square foot. 51 Capen St is a home located in Hartford County with nearby schools including Capital Preparatory Magnet School, Perry Elementary School, and Ib Global Communications Academy.
Ownership History
Date
Name
Owned For
Owner Type
Purchase Details
Closed on
Jan 27, 2006
Sold by
Johnson Pearl
Bought by
Johnson Elyssa
Current Estimated Value
Home Financials for this Owner
Home Financials are based on the most recent Mortgage that was taken out on this home.
Original Mortgage
$127,500
Outstanding Balance
$79,946
Interest Rate
8.3%
Mortgage Type
Purchase Money Mortgage
Estimated Equity
$148,377
Purchase Details
Closed on
Nov 12, 1998
Sold by
One Chane Inc
Bought by
Johnson Pearl
Home Financials for this Owner
Home Financials are based on the most recent Mortgage that was taken out on this home.
Original Mortgage
$88,500
Interest Rate
6.65%
Purchase Details
Closed on
May 20, 1998
Sold by
Hurey Daryl and Hurey Debra
Bought by
Organized Northeast
Home Financials for this Owner
Home Financials are based on the most recent Mortgage that was taken out on this home.
Original Mortgage
$42,750
Interest Rate
1%
Mortgage Type
Purchase Money Mortgage
Purchase Details
Closed on
Sep 11, 1997
Sold by
Nationsbanc Mtg Corp
Bought by
Federal National Mortgage Association
Create a Home Valuation Report for This Property
The Home Valuation Report is an in-depth analysis detailing your home's value as well as a comparison with similar homes in the area
Home Values in the Area
Average Home Value in this Area
Purchase History
| Date | Buyer | Sale Price | Title Company |
|---|---|---|---|
| Johnson Elyssa | $170,000 | -- | |
| Johnson Pearl | $138,500 | -- | |
| Organized Northeast | $25,000 | -- | |
| Federal National Mortgage Association | $24,000 | -- | |
| Johnson Elyssa | $170,000 | -- | |
| Organized Northeast | $25,000 | -- |
Source: Public Records
Mortgage History
| Date | Status | Borrower | Loan Amount |
|---|---|---|---|
| Open | Federal National Mortgage Association | $127,500 | |
| Closed | Federal National Mortgage Association | $127,500 | |
| Previous Owner | Federal National Mortgage Association | $88,500 | |
| Previous Owner | Federal National Mortgage Association | $42,750 |
Source: Public Records
Tax History Compared to Growth
Tax History
| Year | Tax Paid | Tax Assessment Tax Assessment Total Assessment is a certain percentage of the fair market value that is determined by local assessors to be the total taxable value of land and additions on the property. | Land | Improvement |
|---|---|---|---|---|
| 2025 | $4,450 | $64,533 | $4,410 | $60,123 |
| 2024 | $4,450 | $64,533 | $4,410 | $60,123 |
| 2023 | $4,450 | $64,533 | $4,410 | $60,123 |
| 2022 | $4,450 | $64,533 | $4,410 | $60,123 |
| 2021 | $3,445 | $46,375 | $3,920 | $42,455 |
| 2020 | $3,445 | $46,375 | $3,920 | $42,455 |
| 2019 | $3,445 | $46,375 | $3,920 | $42,455 |
| 2018 | $3,329 | $44,812 | $3,788 | $41,024 |
| 2016 | $3,211 | $43,226 | $3,608 | $39,618 |
| 2015 | $3,059 | $41,173 | $3,437 | $37,736 |
| 2014 | $2,984 | $40,166 | $3,352 | $36,814 |
Source: Public Records
Map
Nearby Homes
- 39 Capen St
- 270 Bellevue St
- 33 Warren St
- 35 Loomis St
- 37 Martin St
- 142 Clark St
- 25 Judson St Unit C
- 186 Brook St Unit 188
- 183 Brook St Unit 185
- 152 Brook St
- 147 Enfield St Unit 149
- 158 Martin St Unit 160
- 68 Enfield St Unit 70
- 238 Enfield St Unit 240
- 50 Mansfield St
- 5 Winter St
- 67 Enfield St Unit 37
- 47 Seyms St
- 59 Mansfield St Unit 61
- 410 Garden St
- 45 Capen St
- 37 Capen St
- 62 Capen St
- 48 Capen St Unit 2D50
- 48 Capen St Unit 2C50
- 48 Capen St Unit 2C
- 48 Capen St Unit 2D
- 42 Capen St Unit 2D
- 42 Capen St Unit 2B44
- 42 Capen St Unit 2A44
- 42 Capen St Unit 1B44
- 42 Capen St Unit 1A44
- 42 Capen St Unit 1A
- 42 Capen St Unit 1B
- 42 Capen St Unit 2B
- 31 Capen St
- 60 Capen St
- 36 Capen St
- 36 Capen St Unit 2B
- 36 Capen St Unit 3A