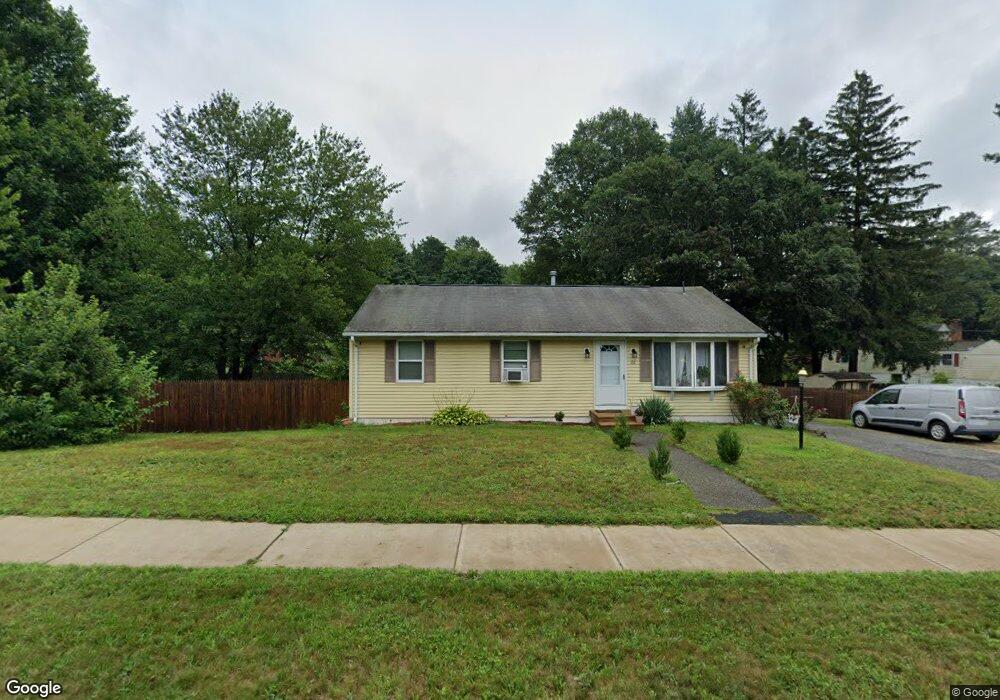
51 Cooley St Springfield, MA 01128
Sixteen Acres NeighborhoodEstimated Value: $277,000 - $335,000
3
Beds
2
Baths
1,176
Sq Ft
$262/Sq Ft
Est. Value
About This Home
This home is located at 51 Cooley St, Springfield, MA 01128 and is currently estimated at $307,849, approximately $261 per square foot. 51 Cooley St is a home located in Hampden County with nearby schools including Daniel B Brunton, M Marcus Kiley Middle, and Springfield High School of Science and Technology.
Ownership History
Date
Name
Owned For
Owner Type
Purchase Details
Closed on
Oct 9, 2009
Sold by
Martinez Pedro J
Bought by
Cooley Hall Nt
Current Estimated Value
Purchase Details
Closed on
Dec 9, 1997
Sold by
Department Of Housing & Urban Dev
Bought by
Martinez Pedro J
Home Financials for this Owner
Home Financials are based on the most recent Mortgage that was taken out on this home.
Original Mortgage
$1,000
Interest Rate
7.11%
Purchase Details
Closed on
Sep 8, 1997
Sold by
Bennett James J and Bennett Mary B
Bought by
First Nationwide Mtg
Create a Home Valuation Report for This Property
The Home Valuation Report is an in-depth analysis detailing your home's value as well as a comparison with similar homes in the area
Home Values in the Area
Average Home Value in this Area
Purchase History
| Date | Buyer | Sale Price | Title Company |
|---|---|---|---|
| Cooley Hall Nt | -- | -- | |
| Martinez Pedro J | $83,000 | -- | |
| First Nationwide Mtg | $110,261 | -- |
Source: Public Records
Mortgage History
| Date | Status | Borrower | Loan Amount |
|---|---|---|---|
| Previous Owner | First Nationwide Mtg | $1,000 | |
| Previous Owner | Martinez Pedro J | $55,000 |
Source: Public Records
Tax History
| Year | Tax Paid | Tax Assessment Tax Assessment Total Assessment is a certain percentage of the fair market value that is determined by local assessors to be the total taxable value of land and additions on the property. | Land | Improvement |
|---|---|---|---|---|
| 2025 | $3,875 | $247,100 | $60,900 | $186,200 |
| 2024 | $3,726 | $232,000 | $60,900 | $171,100 |
| 2023 | $3,410 | $200,000 | $57,900 | $142,100 |
| 2022 | $3,536 | $187,900 | $61,200 | $126,700 |
| 2021 | $3,230 | $170,900 | $55,600 | $115,300 |
| 2020 | $3,207 | $164,200 | $55,600 | $108,600 |
| 2019 | $3,027 | $153,800 | $55,600 | $98,200 |
| 2018 | $2,915 | $148,100 | $55,600 | $92,500 |
| 2017 | $2,800 | $142,400 | $55,600 | $86,800 |
| 2016 | $2,733 | $139,000 | $55,600 | $83,400 |
| 2015 | $2,734 | $139,000 | $55,600 | $83,400 |
Source: Public Records
Map
Nearby Homes
- 119 Acrebrook Rd
- 68 Tallyho Dr
- 239 Hanson Dr
- 17 Skyridge Ln
- 86 Wildwood Ave
- 17 Jeanne Marie St
- 301 Tinkham Rd
- 110 W Crystal Brook Dr
- 1962 Allen St
- 25 Laurelwood Ln
- 23 Rachael St
- 322 Holcomb Rd
- 25 Angelica Dr
- 88 Senator St
- 41 Hillside Dr
- 34 Flora St
- 24 Wands St
- 85 Talmadge Dr
- Lot 37 Kane St
- 2306 Wilbraham Rd
Your Personal Tour Guide
Ask me questions while you tour the home.