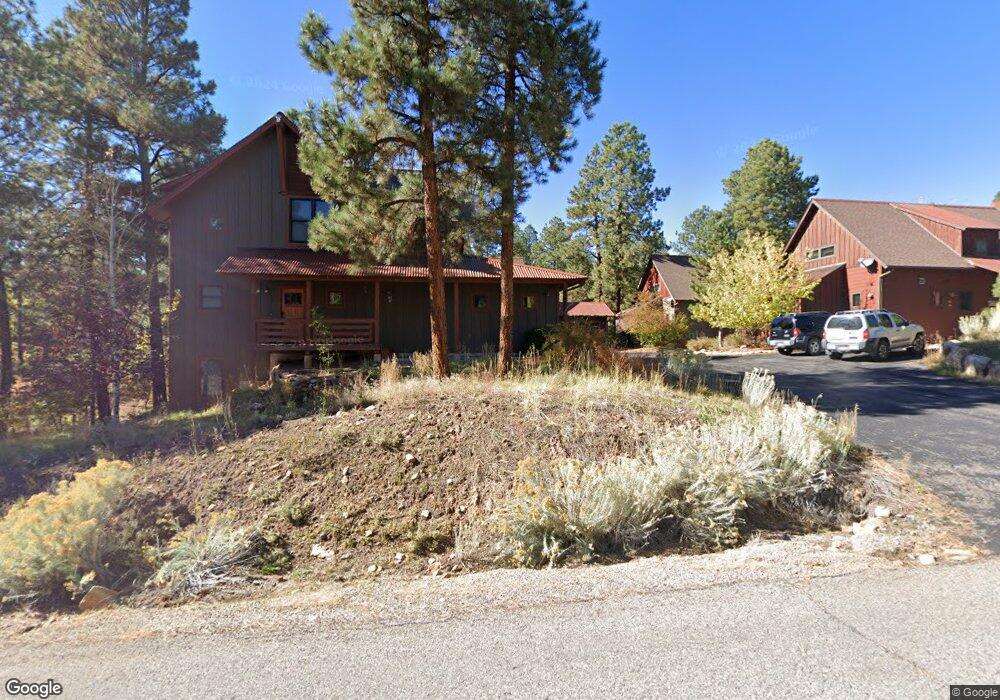
51 Copper Rim Trail Unit H Durango, CO 81301
Edgemont NeighborhoodEstimated Value: $608,378 - $820,000
2
Beds
2
Baths
1,321
Sq Ft
$537/Sq Ft
Est. Value
About This Home
This home is located at 51 Copper Rim Trail Unit H, Durango, CO 81301 and is currently estimated at $709,345, approximately $536 per square foot. 51 Copper Rim Trail Unit H is a home located in La Plata County with nearby schools including Riverview Elementary School, Miller Middle School, and Durango High School.
Ownership History
Date
Name
Owned For
Owner Type
Purchase Details
Closed on
Jun 1, 2018
Sold by
Ouzts Kyle P and Ouzts Leah Marie
Bought by
Wall Janet and Wall Michael Kristopher
Current Estimated Value
Home Financials for this Owner
Home Financials are based on the most recent Mortgage that was taken out on this home.
Original Mortgage
$296,800
Outstanding Balance
$256,102
Interest Rate
4.4%
Mortgage Type
New Conventional
Estimated Equity
$453,243
Purchase Details
Closed on
Feb 28, 2007
Sold by
Ouzts H Kelley and Ouzts Kathleen M
Bought by
Ouzts Kyle P and Ouzts Leah Marie
Home Financials for this Owner
Home Financials are based on the most recent Mortgage that was taken out on this home.
Original Mortgage
$329,400
Interest Rate
6%
Mortgage Type
Purchase Money Mortgage
Purchase Details
Closed on
Sep 16, 2005
Sold by
Four Corners Seven Llc
Bought by
Ouzts H Kelley and Ouzts Kathleen M
Create a Home Valuation Report for This Property
The Home Valuation Report is an in-depth analysis detailing your home's value as well as a comparison with similar homes in the area
Home Values in the Area
Average Home Value in this Area
Purchase History
| Date | Buyer | Sale Price | Title Company |
|---|---|---|---|
| Wall Janet | $371,000 | Land Title Guarantee Co | |
| Ouzts Kyle P | $329,400 | Land Title | |
| Ouzts H Kelley | $293,000 | Land Title |
Source: Public Records
Mortgage History
| Date | Status | Borrower | Loan Amount |
|---|---|---|---|
| Open | Wall Janet | $296,800 | |
| Previous Owner | Ouzts Kyle P | $329,400 |
Source: Public Records
Tax History
| Year | Tax Paid | Tax Assessment Tax Assessment Total Assessment is a certain percentage of the fair market value that is determined by local assessors to be the total taxable value of land and additions on the property. | Land | Improvement |
|---|---|---|---|---|
| 2025 | $1,653 | $32,860 | $5,530 | $27,330 |
| 2024 | $1,465 | $29,240 | $5,010 | $24,230 |
| 2023 | $1,465 | $32,230 | $5,520 | $26,710 |
| 2022 | $1,249 | $34,150 | $5,850 | $28,300 |
| 2021 | $1,264 | $24,810 | $4,720 | $20,090 |
| 2020 | $1,218 | $24,440 | $5,820 | $18,620 |
| 2019 | $1,178 | $24,440 | $5,820 | $18,620 |
| 2018 | $1,068 | $22,000 | $5,740 | $16,260 |
| 2017 | $1,056 | $22,000 | $5,740 | $16,260 |
| 2016 | $1,017 | $22,520 | $6,170 | $16,350 |
| 2015 | $973 | $22,520 | $6,170 | $16,350 |
| 2014 | $5 | $21,070 | $5,380 | $15,690 |
| 2013 | -- | $21,070 | $5,380 | $15,690 |
Source: Public Records
Map
Nearby Homes
- 126 Copper Rim Trail Unit D
- 212 Copper Rim Trail Unit B
- 47 Kenosha Trail
- 71 Deep Creek Ct
- 767 Red Canyon Trail
- 1091 Red Canyon Trail
- 76 Edgemont Highlands Pass
- 170 Hay Barn Rd
- 41 Edgemont Meadows Rd
- 74 Cave Basin Ct
- 65 Mill Creek Ct
- TBD Ventana Pass
- 426 Edgemont Meadows Rd
- 470 Edgemont Meadows Rd
- 671 Edgemont Meadows Rd
- 131 Farm Pond Ln
- 841 Woodbridge Ln
- 188 Farm Pond Ln
- 498 Woodbridge Way
- 220 Edgemont Meadows Rd
- 51 Copper Rim Trail
- 51 Copper Rim Trail
- 51 Copper Rim Trail Unit E
- 51 Copper Rim Trail
- E Copper Rim Trail
- 97 Copper Rim Trail
- 97L Copper Rim Trail
- 97J Copper Rim Trail
- 97 L Copper Rim
- 97 Copper Rim Trail
- 97 Copper Rim Trail Unit K
- 97 Copper Rim Trail Unit I
- 190 Clear Creek Loop
- 97 K Copper Rim
- 18 Tenderfoot Ct Unit H
- 18 Tenderfoot Ct
- 18 Tenderfoot Ct Unit E
- 18 Tenderfoot Ct Unit G
- 205 Clear Creek Loop
- 0 Red Canyon Trail Unit 769837
Your Personal Tour Guide
Ask me questions while you tour the home.