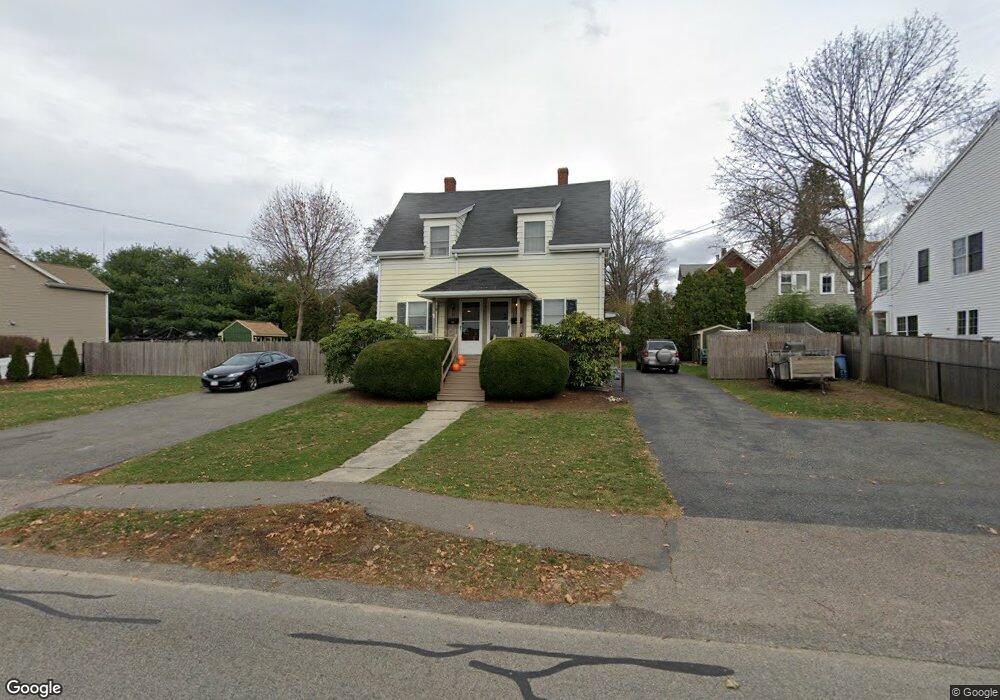
51 Crescent Rd Needham Heights, MA 02494
Estimated Value: $989,000 - $1,117,784
4
Beds
2
Baths
1,136
Sq Ft
$911/Sq Ft
Est. Value
About This Home
This home is located at 51 Crescent Rd, Needham Heights, MA 02494 and is currently estimated at $1,035,196, approximately $911 per square foot. 51 Crescent Rd is a home located in Norfolk County with nearby schools including Sunita L. Williams Elementary School, High Rock Middle School, and Pollard Middle School.
Ownership History
Date
Name
Owned For
Owner Type
Purchase Details
Closed on
Feb 7, 2011
Sold by
Signore Anthony J and Signore Sheila M
Bought by
Sheila M Signore Ret and Signore
Current Estimated Value
Purchase Details
Closed on
Jul 12, 1982
Bought by
Signore Sheila M
Create a Home Valuation Report for This Property
The Home Valuation Report is an in-depth analysis detailing your home's value as well as a comparison with similar homes in the area
Home Values in the Area
Average Home Value in this Area
Purchase History
| Date | Buyer | Sale Price | Title Company |
|---|---|---|---|
| Sheila M Signore Ret | -- | -- | |
| Sheila M Signore Ret | -- | -- | |
| Signore Sheila M | $60,000 | -- |
Source: Public Records
Tax History Compared to Growth
Tax History
| Year | Tax Paid | Tax Assessment Tax Assessment Total Assessment is a certain percentage of the fair market value that is determined by local assessors to be the total taxable value of land and additions on the property. | Land | Improvement |
|---|---|---|---|---|
| 2025 | $9,765 | $921,200 | $747,800 | $173,400 |
| 2024 | $8,045 | $642,600 | $495,500 | $147,100 |
| 2023 | $8,233 | $631,400 | $495,500 | $135,900 |
| 2022 | $7,717 | $577,200 | $446,800 | $130,400 |
| 2021 | $7,521 | $577,200 | $446,800 | $130,400 |
| 2020 | $7,249 | $580,400 | $446,800 | $133,600 |
| 2019 | $6,684 | $539,500 | $406,600 | $132,900 |
| 2018 | $6,409 | $539,500 | $406,600 | $132,900 |
| 2017 | $6,198 | $521,300 | $406,600 | $114,700 |
| 2016 | $6,039 | $523,300 | $406,600 | $116,700 |
| 2015 | $5,908 | $523,300 | $406,600 | $116,700 |
| 2014 | $5,597 | $480,800 | $370,000 | $110,800 |
Source: Public Records
Map
Nearby Homes
- 403 Hunnewell St Unit 403
- 379 Hunnewell St Unit 379
- 381 Hunnewell St Unit 381
- 400 Hunnewell St Unit 103
- 132 Hillside Ave
- 35 Andrea Cir
- 609 Hunnewell St
- 7 Avery St
- 28 Mercer Rd
- 34 Pershing Rd
- 263 Hunnewell St
- 77 High St
- 36 Davenport Rd
- 27 Concord St
- 547 Webster St
- 39 Donna Rd
- 14 Lasalle Rd
- 28 Woodbine Cir
- 443 Central Ave
- 156 Woodbine Cir
- 47 Crescent Rd
- 47 Crescent Rd Unit 47
- 45 Crescent Rd
- 63 Crescent Rd
- 229 Hillside Ave
- 229 Hillside Ave Unit 1
- 58 Crescent Rd
- 65 Crescent Rd
- 249 Hillside Ave
- 249 Hillside Ave Unit 249
- 249 Hillside Ave Unit 1
- 249 Hillside Ave Unit 2
- 217 Hillside Ave
- 17 Union St
- 17 Union St Unit 2
- 52 Crescent Rd
- 50 Crescent Rd
- 50 Crescent Rd Unit 50, Needham Ma 02494
- 15 Union St
- 15 Union St Unit 2