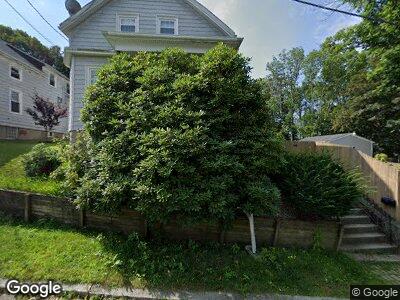
51 Holland St Fall River, MA 02720
Western Fall River NeighborhoodEstimated Value: $367,000 - $480,000
3
Beds
1
Bath
1,118
Sq Ft
$361/Sq Ft
Est. Value
About This Home
This home is located at 51 Holland St, Fall River, MA 02720 and is currently estimated at $403,221, approximately $360 per square foot. 51 Holland St is a home located in Bristol County with nearby schools including North End Elementary School, Morton Middle School, and B M C Durfee High School.
Ownership History
Date
Name
Owned For
Owner Type
Purchase Details
Closed on
Jun 2, 2004
Sold by
Smith Randy G
Bought by
Smith Heather and Smith Randy G
Current Estimated Value
Home Financials for this Owner
Home Financials are based on the most recent Mortgage that was taken out on this home.
Original Mortgage
$198,432
Interest Rate
5.94%
Mortgage Type
Purchase Money Mortgage
Create a Home Valuation Report for This Property
The Home Valuation Report is an in-depth analysis detailing your home's value as well as a comparison with similar homes in the area
Home Values in the Area
Average Home Value in this Area
Purchase History
| Date | Buyer | Sale Price | Title Company |
|---|---|---|---|
| Smith Heather | -- | -- | |
| Smith Randy G | $200,000 | -- |
Source: Public Records
Mortgage History
| Date | Status | Borrower | Loan Amount |
|---|---|---|---|
| Open | Smith Randy G | $240,000 | |
| Closed | Smith Randy G | $205,850 | |
| Closed | Smith Randy G | $198,432 |
Source: Public Records
Tax History Compared to Growth
Tax History
| Year | Tax Paid | Tax Assessment Tax Assessment Total Assessment is a certain percentage of the fair market value that is determined by local assessors to be the total taxable value of land and additions on the property. | Land | Improvement |
|---|---|---|---|---|
| 2025 | $3,551 | $310,100 | $125,800 | $184,300 |
| 2024 | $3,386 | $294,700 | $123,400 | $171,300 |
| 2023 | $3,279 | $267,200 | $111,200 | $156,000 |
| 2022 | $3,089 | $244,800 | $104,900 | $139,900 |
| 2021 | $2,895 | $209,300 | $100,200 | $109,100 |
| 2020 | $2,887 | $199,800 | $95,600 | $104,200 |
| 2019 | $2,904 | $199,200 | $99,900 | $99,300 |
| 2018 | $2,763 | $189,000 | $100,700 | $88,300 |
| 2017 | $2,636 | $188,300 | $100,700 | $87,600 |
| 2016 | $2,557 | $187,600 | $103,800 | $83,800 |
| 2015 | $2,489 | $190,300 | $103,800 | $86,500 |
| 2014 | $2,394 | $190,300 | $103,800 | $86,500 |
Source: Public Records
Map
Nearby Homes
- 492 Quincy St Unit 3
- 327 Quincy St
- 3063 N Main St
- 50 Clark St Unit 12
- 74 Terri Marie Way Unit 6
- 409 Crescent St
- 203 Martha St
- Lot 40-A Jones St
- Lot 40-B Jones St
- 1928 N Main St Unit 4
- 1720 Robeson St
- 3795 N Main St Unit C
- 230 College Park Rd
- 201 Montgomery Cir
- 987 Wilson Rd
- 3850 N Main St Unit 3850
- 393 Langley St
- 208 Florence St
- 361 Adams Unit Lot 41
- 1241 Riverside Ave