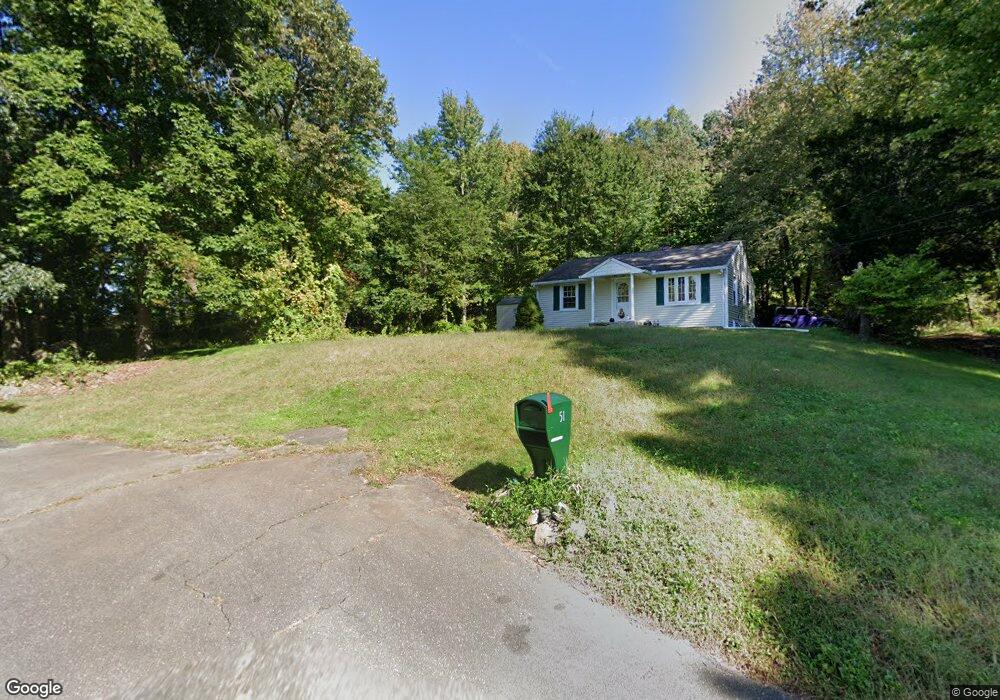
51 Hughes St Naugatuck, CT 06770
Estimated Value: $211,000 - $270,000
2
Beds
1
Bath
720
Sq Ft
$342/Sq Ft
Est. Value
About This Home
This home is located at 51 Hughes St, Naugatuck, CT 06770 and is currently estimated at $246,138, approximately $341 per square foot. 51 Hughes St is a home located in New Haven County with nearby schools including City Hill Middle School and Naugatuck High School.
Ownership History
Date
Name
Owned For
Owner Type
Purchase Details
Closed on
Jul 25, 2005
Sold by
Jfb Properties Llc
Bought by
Cebik Mary L
Current Estimated Value
Home Financials for this Owner
Home Financials are based on the most recent Mortgage that was taken out on this home.
Original Mortgage
$151,000
Outstanding Balance
$78,467
Interest Rate
5.59%
Mortgage Type
Purchase Money Mortgage
Estimated Equity
$167,671
Purchase Details
Closed on
Dec 2, 2004
Sold by
Wells Fargo Bk
Bought by
Jfb Prop Llc
Purchase Details
Closed on
Oct 8, 1999
Sold by
Reyher Fred
Bought by
Sagliano Jason
Home Financials for this Owner
Home Financials are based on the most recent Mortgage that was taken out on this home.
Original Mortgage
$71,920
Interest Rate
9.95%
Mortgage Type
Purchase Money Mortgage
Purchase Details
Closed on
Oct 24, 1988
Sold by
Carrole Marie
Bought by
Chessic Tammie
Home Financials for this Owner
Home Financials are based on the most recent Mortgage that was taken out on this home.
Original Mortgage
$94,800
Interest Rate
10.48%
Mortgage Type
Purchase Money Mortgage
Create a Home Valuation Report for This Property
The Home Valuation Report is an in-depth analysis detailing your home's value as well as a comparison with similar homes in the area
Home Values in the Area
Average Home Value in this Area
Purchase History
| Date | Buyer | Sale Price | Title Company |
|---|---|---|---|
| Cebik Mary L | $168,000 | -- | |
| Jfb Prop Llc | $49,000 | -- | |
| Sagliano Jason | $89,900 | -- | |
| Chessic Tammie | $118,500 | -- |
Source: Public Records
Mortgage History
| Date | Status | Borrower | Loan Amount |
|---|---|---|---|
| Open | Chessic Tammie | $151,000 | |
| Previous Owner | Chessic Tammie | $71,920 | |
| Previous Owner | Chessic Tammie | $55,000 | |
| Previous Owner | Chessic Tammie | $94,800 |
Source: Public Records
Tax History Compared to Growth
Tax History
| Year | Tax Paid | Tax Assessment Tax Assessment Total Assessment is a certain percentage of the fair market value that is determined by local assessors to be the total taxable value of land and additions on the property. | Land | Improvement |
|---|---|---|---|---|
| 2025 | $4,434 | $111,440 | $19,110 | $92,330 |
| 2024 | $4,657 | $111,440 | $19,110 | $92,330 |
| 2023 | $4,987 | $111,440 | $19,110 | $92,330 |
| 2022 | $3,306 | $69,240 | $16,110 | $53,130 |
| 2021 | $3,306 | $69,240 | $16,110 | $53,130 |
| 2020 | $3,306 | $69,240 | $16,110 | $53,130 |
| 2019 | $3,272 | $69,240 | $16,110 | $53,130 |
| 2018 | $3,810 | $78,800 | $30,140 | $48,660 |
| 2017 | $3,826 | $78,800 | $30,140 | $48,660 |
| 2016 | $3,756 | $78,800 | $30,140 | $48,660 |
| 2015 | $3,591 | $78,800 | $30,140 | $48,660 |
| 2014 | $3,551 | $78,800 | $30,140 | $48,660 |
| 2012 | $3,849 | $114,720 | $44,040 | $70,680 |
Source: Public Records
Map
Nearby Homes
- 15 Neagle St
- 32 Acushnet St
- 465 N Main St
- 119 Prospect St
- 48 Picture Ln
- 333 Wooster St
- 32 Greenwood St
- 29 Ramsey Ave
- 48 & 50 Anderson St
- 142 Applewood Ln
- 39 Alma St
- 51 Brook St Unit 7A
- 51 Brook St Unit 6A
- 631 High St
- 38 Tyler Hill Rd
- 105 John St
- 136 High Ridge Rd
- 111 Mallane Ln Unit 19A
- 69 Nancy Ln
- 66 Nancy Ln